Sometimes you may need to display who logons your server except for the authenticated domain users. It could be authenticated users from the trusted domain, local users, system services, etc.
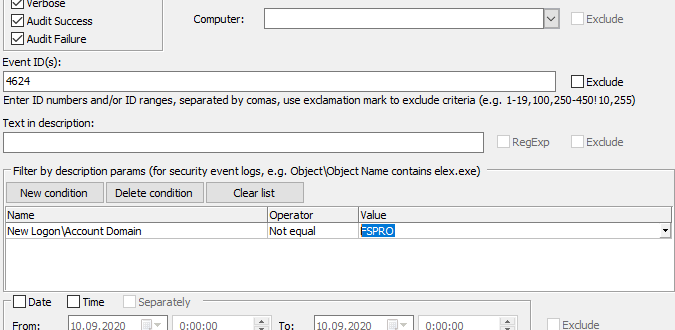
First, we define that we will filter the Security log by Event Id = 4624 (as we did before).
New logon group describes the details of a user who logs on.
Let’s display events 4624 where New Logon\Account name is not FSPro. It is very
easy to do using Event Log Explorer filter.
This method works well, but it has several drawbacks:
Filtering by description params works not so fast – Event Log Explorer parses the description every time and checks its params.
Filtering by description params depends on the Windows language. In non-English systems, param names like Account Domain could be translated.
This approach won’t work with Elodea – if you decide to make such a feed.
It works only with Event Log Explorer. In Windows Event Viewer this or similar functionality is not available.
XML Query doesn’t have these drawbacks, but it’s harder to
compose.
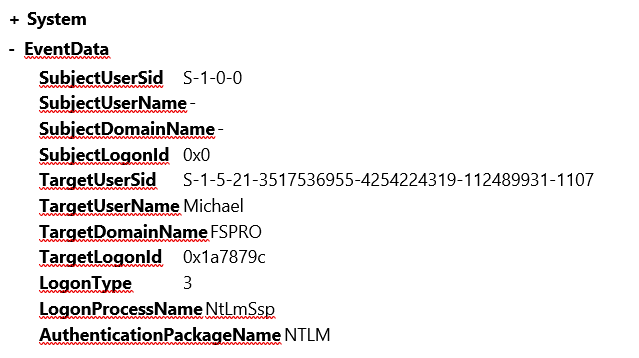
Double click on 4624 event and switch to XML tab.
We need to exclude events with TargetDomainName equals to
FSPRO.
You may consider that the XML query should look like
<QueryList>
<Query Id=”0″ Path=”Security”>
<Select Path=”Security”>
*[System[(EventID=4624)]]
and
*[EventData[Data[@Name=’TargetDomainName’] and (Data!=’FSPRO’)]]
</Select>
<Query>
<QueryList>
But this query is wrong. Clause “*[EventData[Data[@Name=’TargetDomainName’] and (Data!=’FSPRO’)]]” will return true in most cases since Data has multi values for the most events.
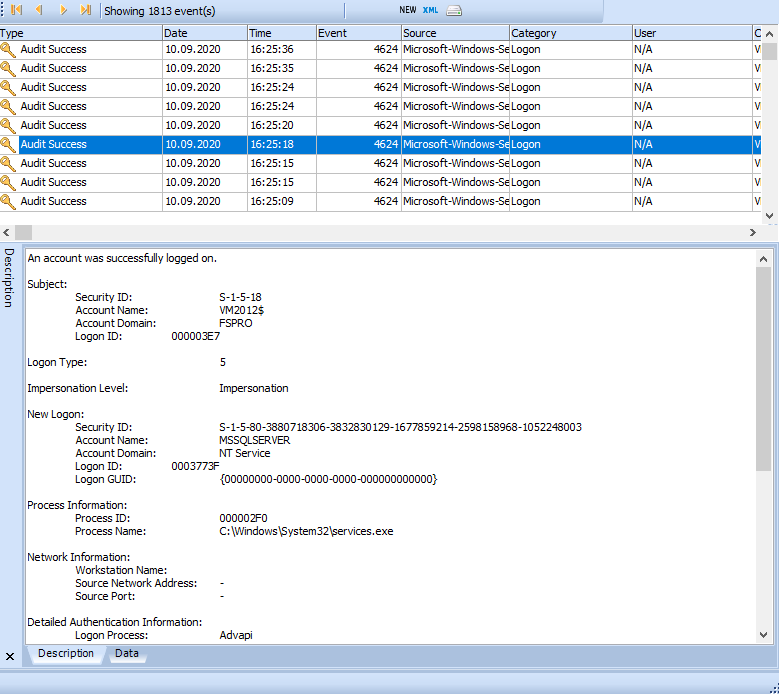
When you take the first look to Event Log Explorer, you may notice Type column in the event list. In the same time, Windows Event Viewer doesn’t have this column, which may confuse you.
If you worked with Windows Event Viewer in old times (with Windows XP or below), you could see the Type column. There were 5 types of events that can be logged in the classic Windows event log: Error, Warning, Information, Audit Success, and Audit Failure. The last 2 types were used for the Security log only.
Since
Windows Vista (Windows Server 2008), Microsoft removed Type from the event
schema and replaced it with Level. Windows uses the following levels: Critical,
Error, Warning, Information, Verbose (although software
developers may extend this set and add own specific levels). These levels define
event severity, but they don’t define auditing status (success or failure). There
is a new event attribute called keywords. Keywords is a 64-bit mask, every bit
of each may represent a keyword. 2 bits of this mask represent Audit Success
and Audit Failure events.
When a modern Windows Event Viewer displays the Security event log, it shows Keywords column and hides Level column by default. When it displays the other logs, it shows Level and hides Keywords. We believed that this behavior is not very smart and decided to leave classic behavior. So, we added Type column and removed Level and Keywords from the event list. When Event Log Explorer displays events, it defines the source of the event first. If this is an audit event from the Security log, it checks the keywords and displays either Audit Success or Audit Failure as the event type. If this event is not from the security log, it displays the event level as a type. We believe that this approach is better because we can merge security and other events in one list and show only one column for this. And this provides better compatibility with classic event logs as well.
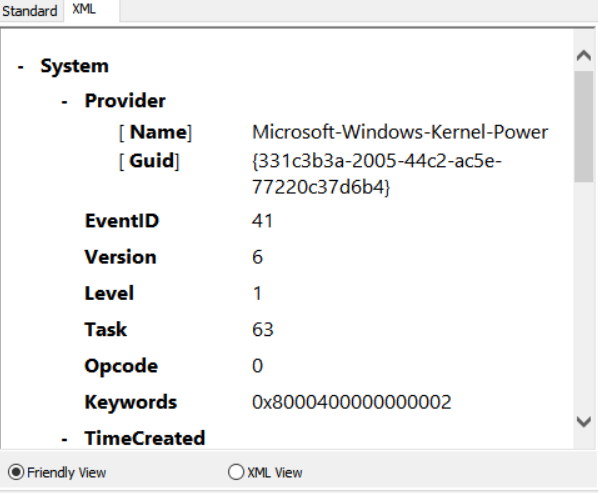
Anyway, if
you need to access real level and keywords attributes, you can always doubleclick
on the even and check the XML representation of the event.
Download Event Log Explorer right now and check the benefits it brings in comparison with Windows Event Viewer.
Nowadays, Windows PowerShell is considered as a replacement of the classic Windows Console (Command Prompt) utility. In Windows 10, it can be set as a default console in Win+X menu
In most cases, when you run command-line utilities from PowerShell and Command Prompt, they will behave exactly the same. However, we discovered that sometimes our command-line utilities work incorrectly when starting from PowerShell, while there are no problems with CMD. After researching, we found that PowerShell may modify command line parameters.
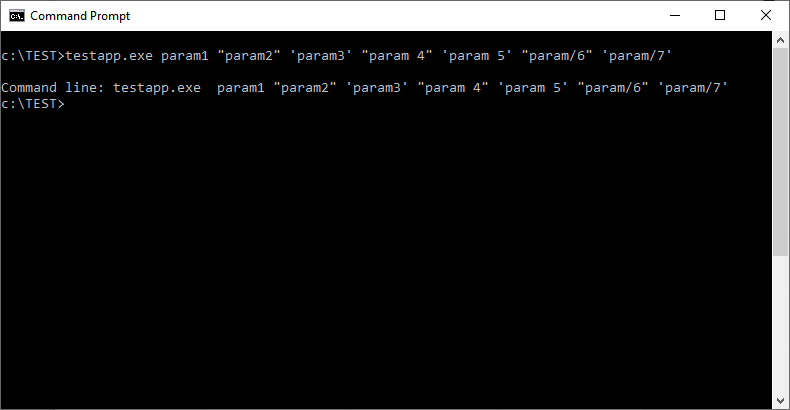
I wrote a simple program which displays its own command-line string:
As you can see, the output of this program exactly matches the input.
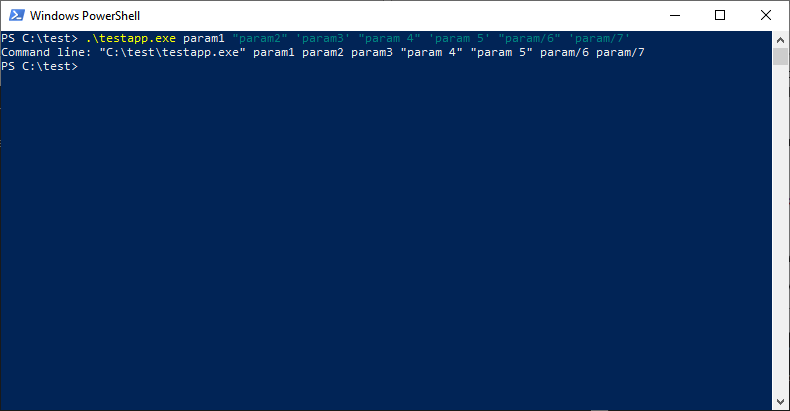
Surprise! PowerShell
changes command line by removing the quotation marks when an argument has no
space and replacing single quotes with the double quotes. And this may affect
third-party utilities.
Why does
PowerShell do that?
PowerShell
is not just a console to run programs. It is a system to run scripts. And it
considers strings enclosed in quotes as PowerShell strings.
Workaround
First, if you come across such an issue, we recommend you contact the developers and report this issue. In our products, we will fix these incompatibility issues soon.
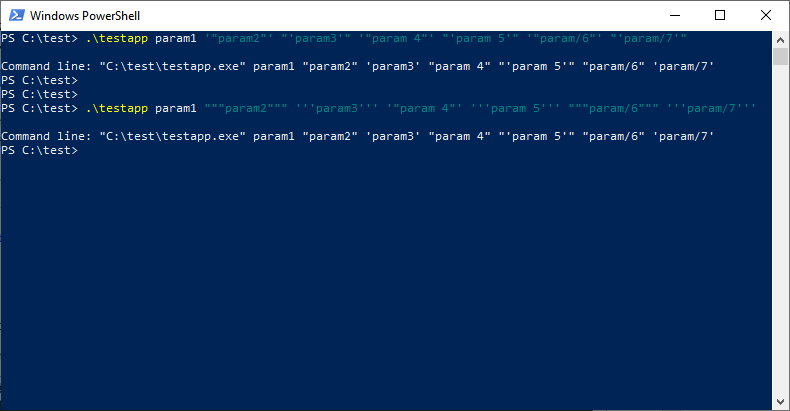
As a
workaround, you can enclose double quotes inside single quotes or use two
sequential double quotes:
All seems to be OK except ‘param 5’ parameter, but I believe It’s more important that param/6 and param/7 problems were fixed since they could conflict with command-line switches.
Event Log Explorer can export events into Excel, HTML, CSV and PDF files. The export is implemented as an option of user interface and it can be scheduled using internal Event Log Explorer scheduler. Some time ago, I wrote a couple of articles how to schedule export of events into Excel: https://eventlogxp.com/blog/exporting-event-logs-with-windows-powershell/
Both
methods are not without drawbacks. The Powershell method doesn’t work well with
multi-line descriptions, and Event Log Explorer scheduler requires you to have
Event Log Explorer running.
That’s why
we are removing the scheduler from Event Log Explorer and releasing a new command-line
utility to export events into document files. LogExport utility will be
included with new Event Log Explorer 5 and it’s designed to export Event Log
Explorer tasks (special event views). However, you can use it even right now to
export the whole event logs or log files.
LogExport utility (beta version) is available for download at https://eventlogxp.com/download/logexport.exe
LogExport can save your events in Microsoft Excel (XLSX), Open Document (ODS), CSV, HTML and PDF files. As a console utility, you can schedule it with Task Manager. The command-line interface is clear and well documented. The usage details are available when you run the utility without parameters.
Examples:
To export local
Security log into Excel file, just run it as follows:
logexport /LOGNAME:Security
Note that you
may need to run it as administrator to access the security log.
To export
Application log from server SERV1 into App.pdf file, run it as follows:
Event Log Explorer comes with 3 methods of opening event log files: Standard, New API and Direct. Such an abundance of options may confuse users when choosing the method.
“What
opening method should I use?” – a very common question of our customers.
The answer is very simple:
In most cases use New API method.
But what the
other methods for?
First, I
should remind that Event Log Explorer supports 2 formats of Event Log Files: classic
EVT and modern EVTX. Windows NT, 2000
and XP/2003 log events into EVT files. To access these files Windows introduced
a special Event Logging API which we call StandardAPI). Starting from Windows
Vista/2008, Windows uses EVTX format. In the same time a new Windows Event Log
API was introduced. For compatibility reasons, Windows allowed to open any file
with any API although since Windows 7 support of EVT files was terminated.
In addition
to Windows API, we developed our own way to access event files without using
any API (direct access).
So if you have a modern Windows PC and you want to read classic EVT files, you have no choice except Direct method. More details are available in this article.
And if you want to open EVTX files, always use New API method. Using Standard method would also work, but for some events it may give you incorrect details. You can use Standard method e.g. if you are a software developer and make your own logging. In this case you may check your log to verify how it will look in legacy event log viewers. Direct method for EVTX files was designed to access these files on old Windows XP machines or to access corrupted EVTX log files.
At the time, the US companies spend a total of $120 billion on printed forms annually, and each employee uses about 10,000 sheets of paper according to CompTIA. That’s why printer usage monitoring is very important to cut costs for printer supplies and their utilization. Another reason to know who and how uses corporate printers is to manage your resources and plan upgrades or downgrades of certain printers or print servers.
If you google for “printer usage” or similar phrases, you will find dozens of special software to monitor printers. As a rule, these programs are installed on print servers and most of them are not cheap.
However,
you can track printer usage without any third-party software by analyzing
Windows events of Print Spooler. And use of Event Log Explorer makes this
process much better.
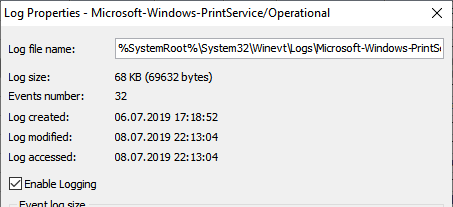
To start monitoring you should enable logging to log \Microsoft-Windows-PrintService/Operational:
Start Event Log Explorer (or Event Viewer), connect to your print server from Event Log Explorer or Windows Event Viewer, browse to event log Microsoft-Windows\\Microsoft-Windows-PrintService/Operational, click right mouse button on it and select Properties.
In Log Properties dialog tick Enable Logging.
Or just run wevutil utility in the elevated prompt as follows:
I assume that you have a print server (Server_name) in your network (running Windows 2008 or higher) and your users print documents via this server. If you have printers connected directly to the user computers, you should consider these computes as print servers and enable logging to PrintService/Operational on them.
If you want to monitor what exactly your user print, I recommend enabling “Allow job name in event logs” policy to log documents name. If you run Windows 2012 or Windows 8, you may need to apply a Windows update as described here.
Now when a user prints a document, several events will be logged into PrintService/Operatinal event log.
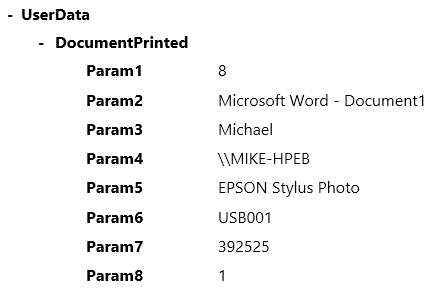
The most interesting event for printer usage tracking is event 307 (document was printed). If you open event details of this event and switch to XML representation, you will get detailed information about printing.
Param1 is a print job identifier and can be used to link with other events in this log. Param2 is a document name (if you didn’t enable “Allow job name in event logs” policy, the document name will be “Print Document”. Param3 and Param4 define document owner and computer from which the document was sent to print. Param5 is a printer name. Param6 is a name of the print server port. Param7 is a document size in bytes sent to print server. Param8 is a total number of pages printed by this print job.
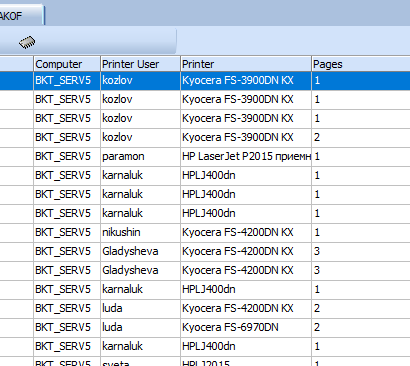
So, let’s display some of these details in Event Log Explorer. I will add a printer user (a document owner), printer name, and number of pages as event list columns.
First, we need
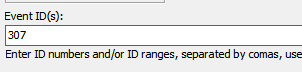
to filter unnecessary events out and display only events with event id = 307.
Press Filter button and type 307 in Event ID(s) filed of
the Filter window.
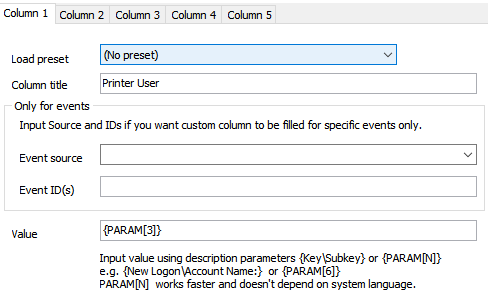
Now we should
add custom columns. Select View->Custom columns from the main
menu and add the first column (Printer user) as follows:
Column
title: Printer user
Value: {PARAM[3]}
Switch to
Column 2 tab and add the second column:
Column
title: Printer
Value: {PARAM[5]}
Switch to
Column 3 tab and add the second column:
Column
title: Pages
Value: {PARAM[8]}
Press OK to
finish and you will see 3 columns in the event list with your data.
Now you can
run Analytical Report and select Custom Column1 stats. This will summarize user print sessions and let
you detect users who print a lot. However, this summary doesn’t take into
account the number of pages, so I recommend using Excel for more accurate assessment.
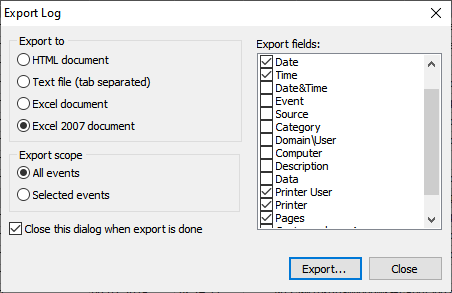
To export
to Excel, select File -> Export Log from the main menu. Select Excel
2007 document as a target format, make sure that All events is
selected as export scope and tick fields Printer User, Printer and Pages. You
can untick other fields.
Press Export
button and save your data in XLSX document.
That’s it.
Now you can open your XLSX file in Excel and build summary reports from it.
P.S. Some companies may still use old Windows 2003 server to run their print servers. And Event Log Explorer will help in this case too. Print events for Windows 2003 are recorded into System log. Event source is Print, event id = 10. To display Printer user, Printer and page count as custom columns use {PARAM[4]} {PARAM[5]} and {PARAM[8]} respectively.
Update of May 18, 2020: It looks like Windows 10 1909 doesn’t have this issue.
Although era of Windows XP is over, there are still a great number of PCs running this operating system or Windows 2003 Server. According to different researches, in 2018 Windows XP market share was more than 4% of all desktop operating systems. Windows 2003 Server still has more than 10% of server operating systems. Moreover, Microsoft still supports Windows Embedded POSReady 2009 which is based on Windows XP.
This means
that millions of computers across the globe still run XP-based OS and log their
events in classic (evt) event logs.
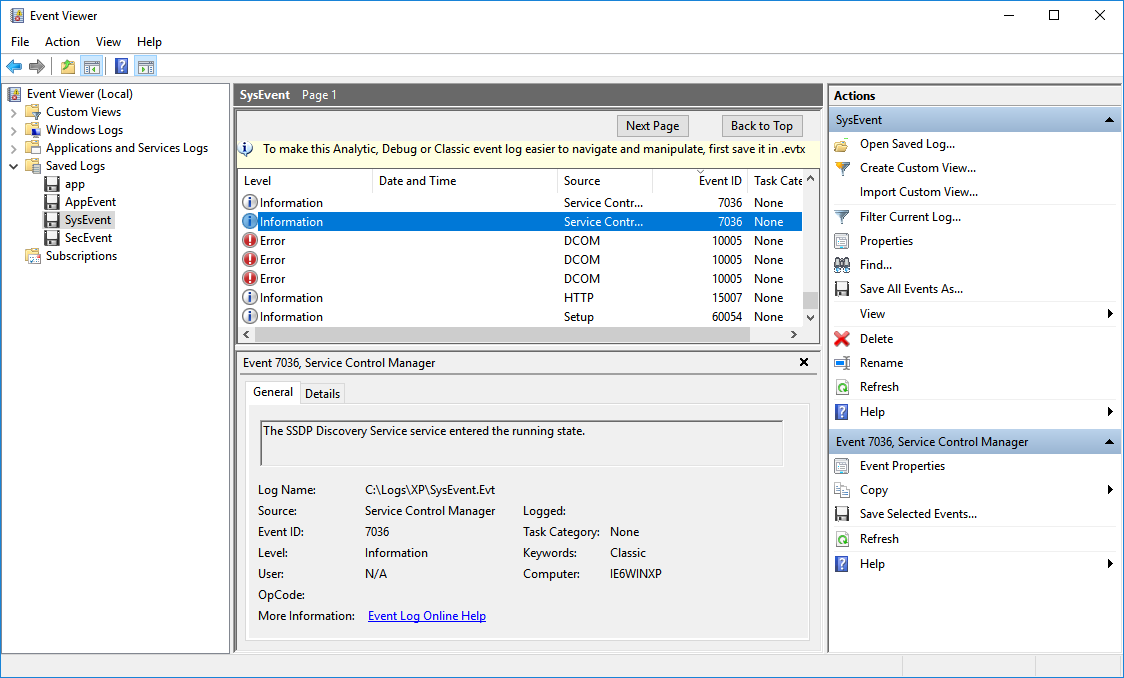
When
Windows Vista appeared in 2007, it introduced a new event log format along with
new Event Viewer. This Event Viewer went through Windows 7, 8, and got to
Windows 10 practically unchanged. It was designed to open event log files in both
formats – new (evtx) and legacy (evt).
Unfortunately, Windows API doesn’t support evt files anymore and API function OpenBackupEventLog returns error 1500 (Log file is corrupted) when opening evt files. That’s why many third-party event viewers cannot read evt files on modern Windows. Event Viewer parses evt files and displays them like native evtx files. However, Windows 10 Event Viewer stopped working correctly. First, we noticed that it doesn’t display event date and time for evt log files exported with Event Log Explorer (our application can export events to legacy format). Suggesting that this issue could be a bug of Event Log Explorer, we took several event log files from Windows XP – we saved several event logs as files using Windows XP Event Viewer and got a couple of “live” legacy event logs. In every case, Windows 10 Event Viewer failed to display event datetime for these log files.
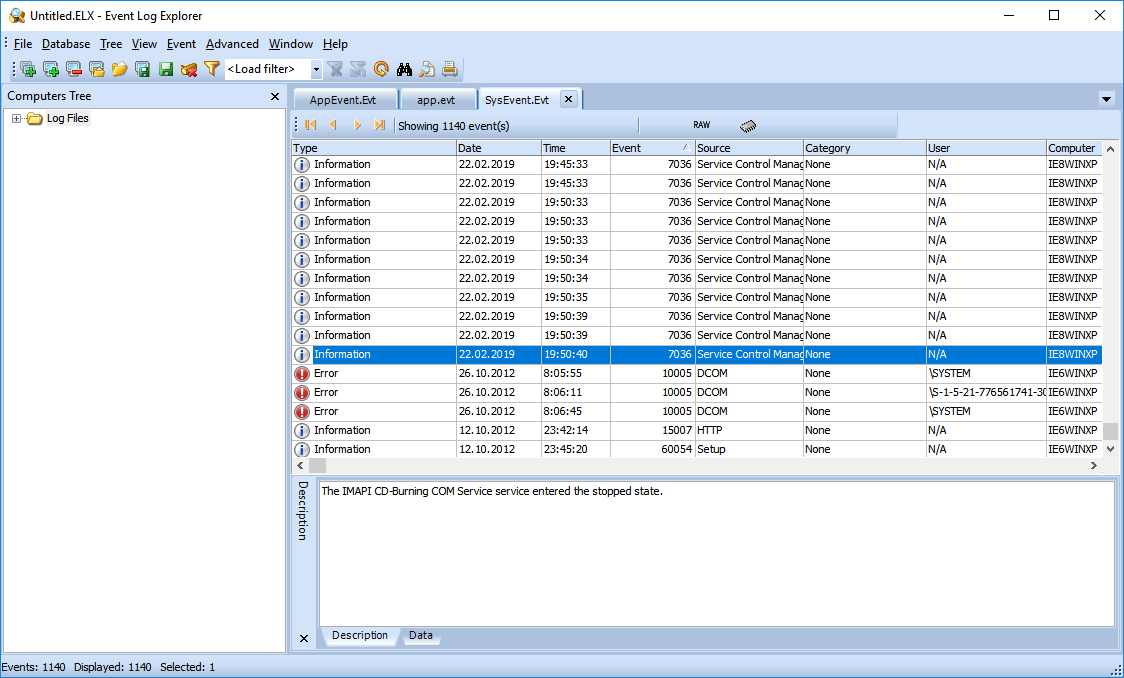
Since event
timestamp is a key field for any forensic examination, this makes impossible
using Windows Event Viewer as a forensic tool for legacy log analysis.
Event Log
Explorer doesn’t have this problem and displays event date and time correctly.
In this
article I will demonstrate how to setup and configure Elodea on your PC.
To simplify
the demonstration process, we will work solely with a local computer. But you
can use this experience when setting up Elodea in your network.
First, you will need to install Microsoft SQL Server.
Elodea
supports all SQL Servers editions (starting from SQL Server 2008), so you may
try even free SQL Server Express available at
You can use
any Windows (server or workstation) starting from Windows Server 2008 (or
Windows Vista).
Install SQL Server on your computer. You can setup it with the default installation options.
It is not
necessary, but I would recommend to install SQL Server Management Studio (SSMS).
SQL Server installer may prompt you to install SSMS or you can download it from
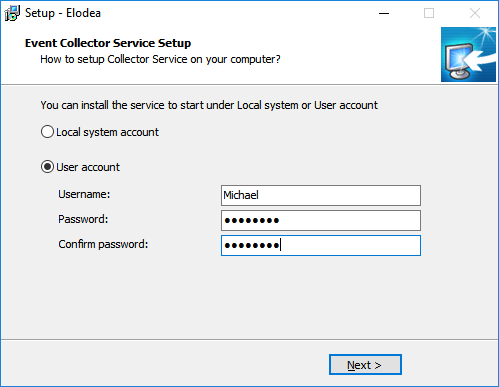
Start Elodea installer by running file elodea_setup.exe
Follow the setup wizard steps. When the Setup prompts you to install Collector Service, select to install it under a User account and input your own Windows user name and password in the related lines.
We will run
the service under a user account because SQL Server Express by default enables
only Windows user authentication and assigns the dbo rights to a user who
installed the SQL Server.
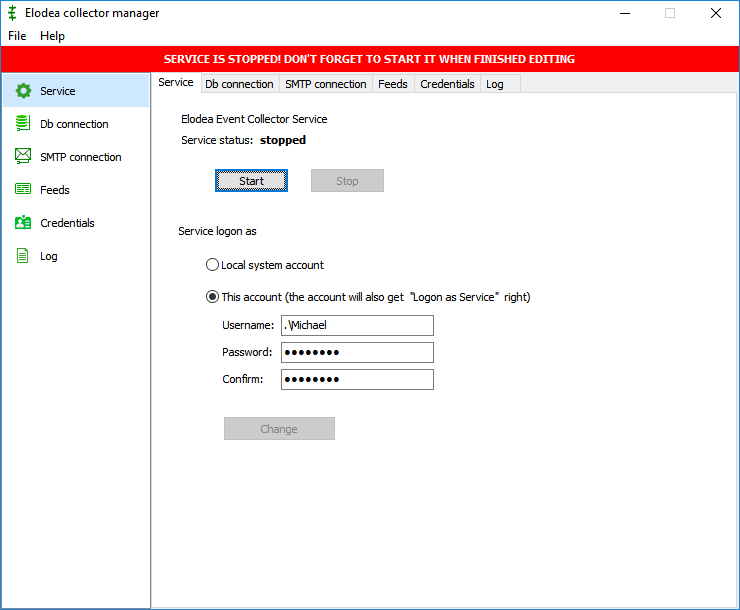
Now you can
configure Elodea by starting Elodea Event Collector Settings from Windows Start
menu.
Review the Settings tab and make sure that the
service not started. Switch to the Db Connection
tab to configure database connection.
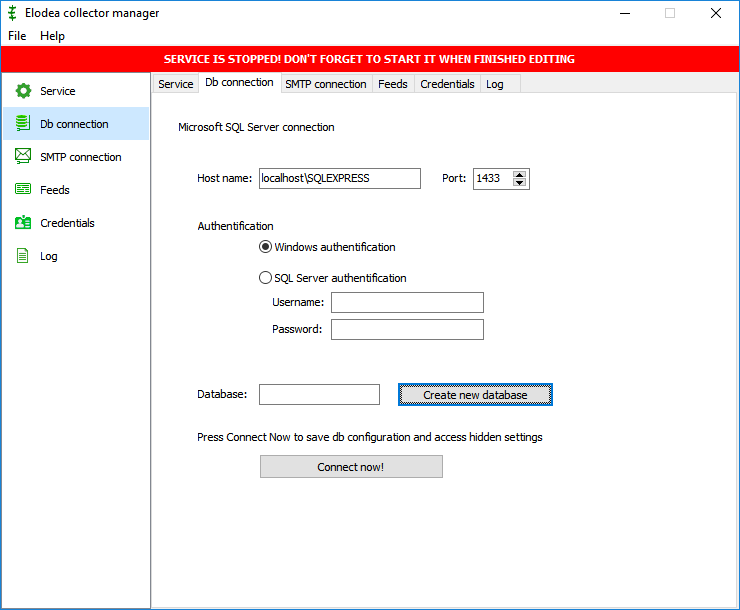
Input localhost\SQLEXPRESS
into Db Connection (this is the default instance name for SQL Server Express on
a local computer, you can also use COMPUTER_NAME\ SQLEXPRESS).
Click Create new database to create a new
database. A new window will appear.
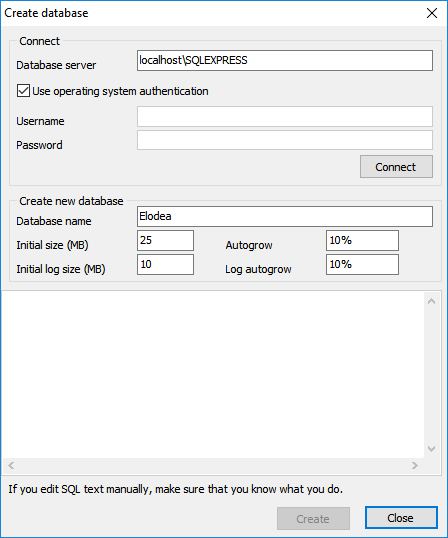
Click Connect button, type Elodea
into the Database name, and then click Create
button. You will see a message that the database was created, then this window
will be closed and the program will connect to this new database.
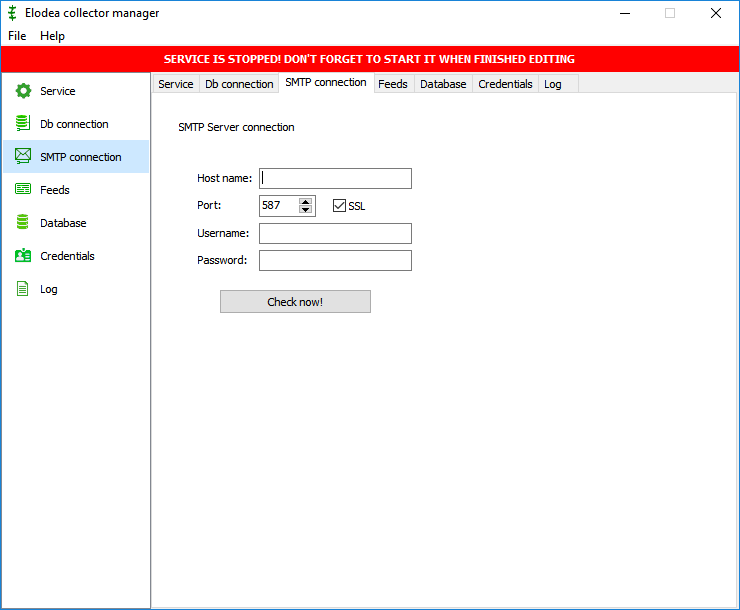
Switch to SMTP Connection to set up connection to
a SMTP server to receive alerts from Elodea.
Type your
SMTP server name, input SMTP port number and enable SSL connection if required.
Enter your name and your password and then click Check now to verify connection and save your settings.
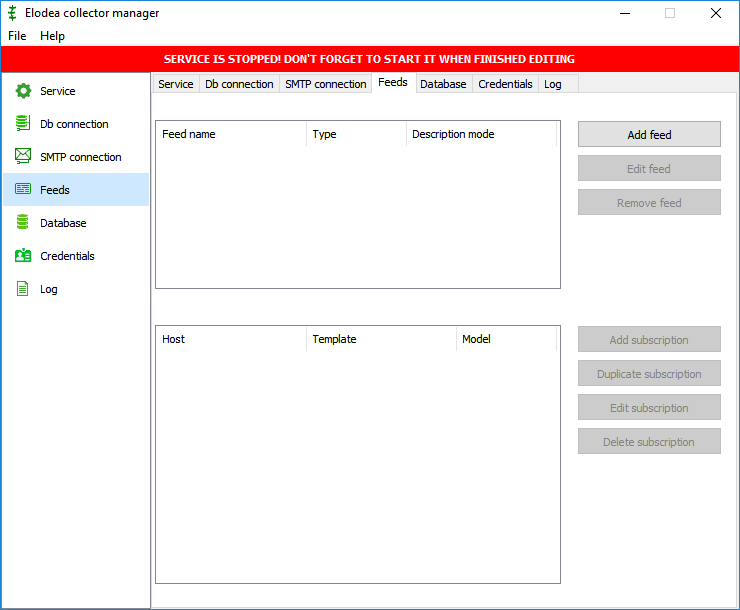
Switch to the
Feeds tab.
Feed is a
special Elodea entity that describes what events and from what sources will be
collected by Elodea.
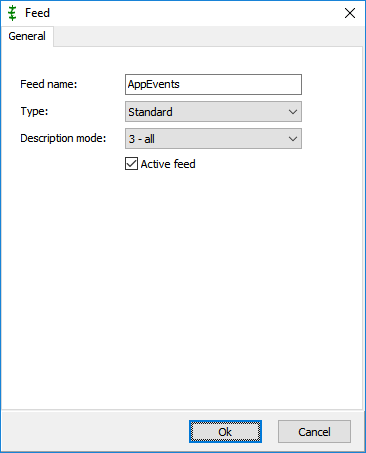
Create a
feed for Application events by clicking on Add
feed button.
Type AppEvents
into as feed name and change Description
mode to 3 – all. Click Ok.
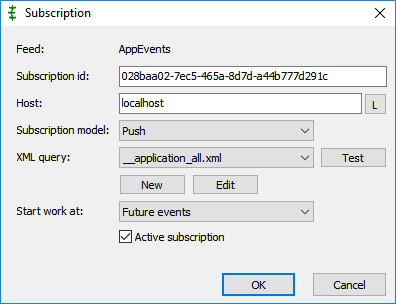
Then create a subscription in this Feed by clicking on Add subscription button.
Set Subscription model to Push and set XML query to __application_all.xml.
Click Test button to verify the selected XML query is valid. Press OK button.
We created
a Standard feed subscribing to all application events on a local computer.
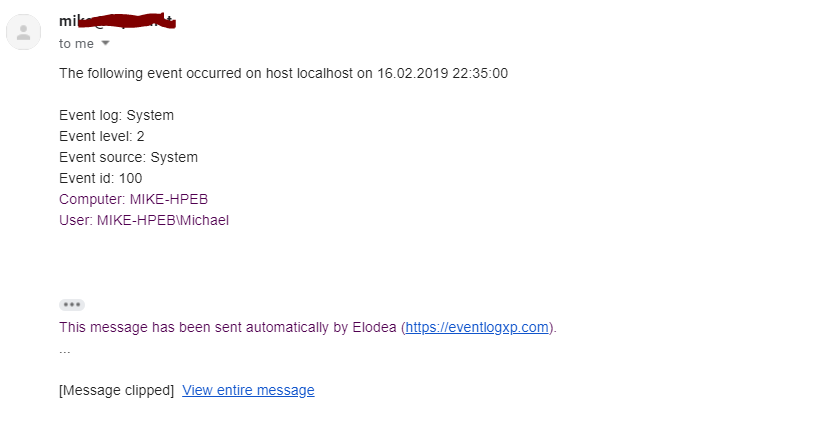
Let’s
create a feed that receive error events from Application and System logs and
sends email notifications on errors:
Create Add feed button.
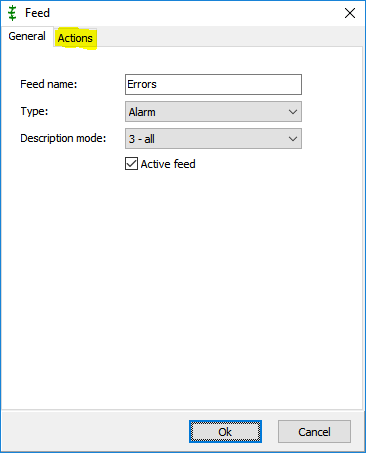
Type Errors into Feed name, change Type to Alarm and change Description mode to 3.
Note that a
new type Actions appear in the top
of this window. Switch to this tab.
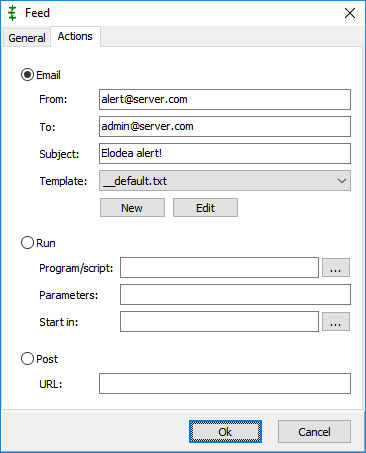
Select Email option, then input your email
details into From, To and Subject fields. Make sure that addresses are valid.
Set Template to __default.txt and click
OK button.
Press Add
subscription, set Subscription model
to Push and set XML query to __application_system_error.xml,
then press OK.
Now you
have 2 feeds, AppEvents and Errors.
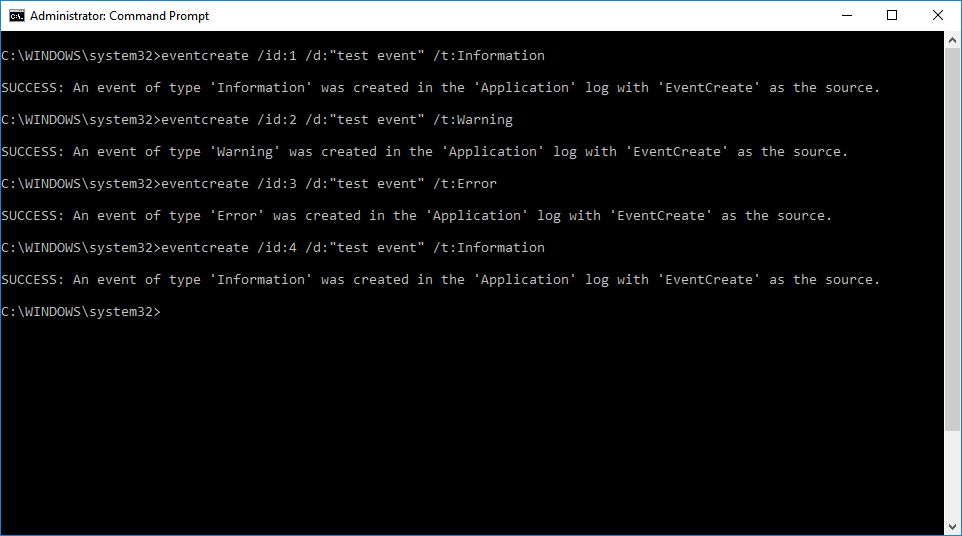
Let’s try
it! Switch to the Service tab and click Start and make sure that the service
status has changed to running. Make
several events in the application log.
Let’s view
what is in the database. You can check it using SQL Server Management Studio,
but it is better to view the database using Event Log Explorer:
Start Event
Log Explorer.
Select Database -> Connect from the main
menu.
Enter localhost\SQLEXPRESS
into Database server field, tick Use operating system authentication, type Elodea
into Database name field, then click OK.
Now you can
load tables. Select Database -> Load
table from the main menu.
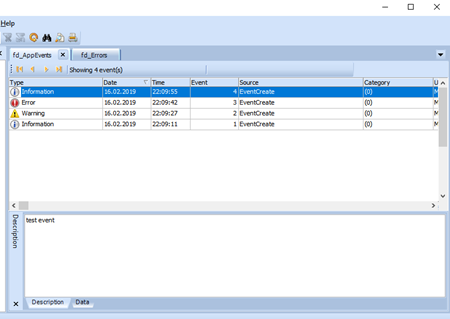
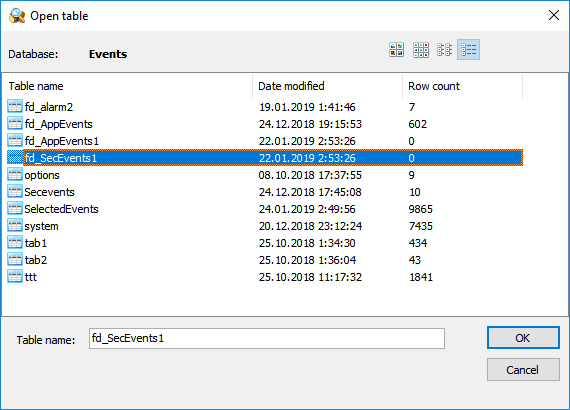
Select
fd_AppEvents, then select Database ->
Load table again and select fd_Errors.
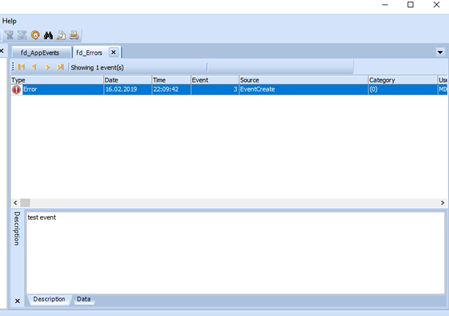
2 tabs will
appear in Event Log Explorer:
fd_AppEvents
fd_Errors
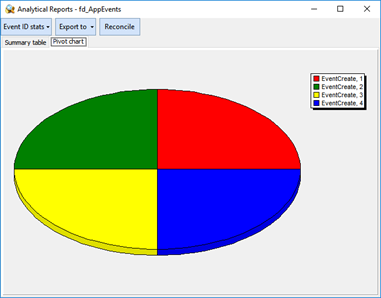
And you can work with these tables in Event Log Explorer as you work with a general event logs. E.g. you can run analytical reports for these events:
Error feed should
also collect errors from the system log. Test it:
One of the great features in Event Log Explorer 4.7 is a command line utility to export event logs to the database (eldbx.exe). Using this utility, you can make a centralized storage of events for better forensic investigations and improve system and security management on your network.
In the previous article I described how to export events into the database directly from Event Log Explorer application. You can use new Database -> Upload to table command to save a current log view into a SQL table. However, this method has a number of drawbacks:
You need to open event log before export
It is difficult to export many logs in a row
If exporting XML data option enabled, the whole export procedure may take very long time.
Event Log Database Export Utility (eldbx.exe) is free of these drawbacks. It’s a console utility and you can use it in batch files to export different logs in a row. And it is always exporting XML data fast enough.
The utility is described in Event Log Explorer documentation.
The output table is compatible with Elodea table format. And you can load the exported tables in Event Log Explorer using Database -> Load table command.
How to use Event Log Database Exporter.
The utility is compatible with Microsoft SQL Server (or SQL Server Express) 2008 or better.
First, we recommend you to create a separate database for the logs. You can create it from Event Log Explorer as described in Using Event Log Explorer to access database events or create it using SQL Server utilities (e.g. Microsoft SQL Server Management Studio).
Alternatively, you can create the database using the utility itself:
Just run it using CreateDB command. E.g. if you have SQL Server Express installed on your local machine, to create database Events on it, just run the utility as follows:
eldbx will try to connect SQLServer using your current Windows credential and create database Events using default parameters. You can check other database settings on eldbx documentation page. For database tuning, I recommend using SQL Server Management Studio to create or alter the database – it gives maximum flexibility in fine-tuning the database.
Now, let’s export local system log into SQL table SysEvents.
This command assumes that your current user have access to the system event log from Host1. If your permissions are not enough, you can explicitly specify user name and password to access the log. Just add 2 parameters to the previous command line:
Let’s export the Application event log without Information and Warning events and add the System log without Information events.
First, we need to create an XML query. Since the syntax of XML query allows to join different logs, we can get all the required events in one query and export it at once (without using /TXA:append option).
<QueryList>
  <Query Id="0">
    <Select Path="Application">*[System[(Level=1 or Level=2)]]</Select>
    <Select Path="System">*[System[(Level=1 or Level=2 or Level=3)]]</Select>
  </Query>
</QueryList>
You can use Windows Event Viewer to create basic XML queries or edit them manually.
Event Log Explorer 4.7 comes with new features to save events into SQL server database and load database events.
Saving events into a database gives you many advantages. You can consider event database as an event log backup. You can collect data from different computers in your network into one database and then use any reporting or analytical tools to create your own reports or carry out forensic analysis. You can view database events with Event Log Explorer like general Windows events, but Event Log Explorer uses power of SQL Server and deliver faster performance.
You should have Microsoft SQL Server 2008 or better or Microsoft SQL Server Express 2008 or better.
Event Log Explorer can use embedded into Windows Data Access Components (Windows DAC) to connect to SQL Server – it doesn’t require SQL Server Native Client. However, if you have Native Client installed, it will use it instead of Windows DAC.
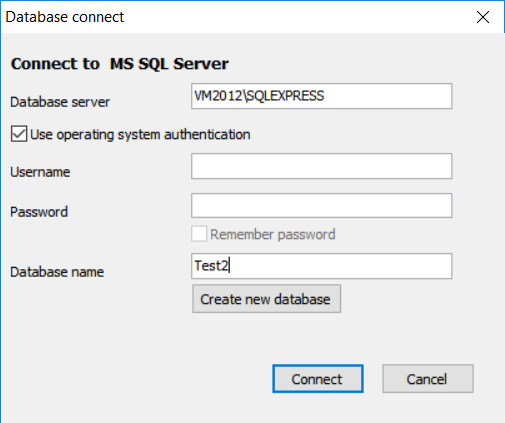
Database connecting
To connect to the database, you should select Database -> Connect from the main menu.
Enter server instance name into database server. In most cases, you can enter the computer name of the database server. If you are connecting to SQL Server Express, use the computer name followed by \SQLEXPRESS.
Enable Use operating system authentication to connect using your Windows account. If your SQL server isn’t configured to support your Windows account, disable this option and enter SQL Server username and password.
Enter database name into Database name field. If you don’t have a database to store events, you can create it either with Event Log Explorer or with other tools.
If you want to create a database with Event Log Explorer, click Create new database button. Type server name and your credentials and click Connect button. Then type a new database name, fill in the database parameters and review the creation script. You can modify this script if you know what you do. Then click Create button to run the script and create the database.
Click Connect to connect the database.
Now you upload your events into database.
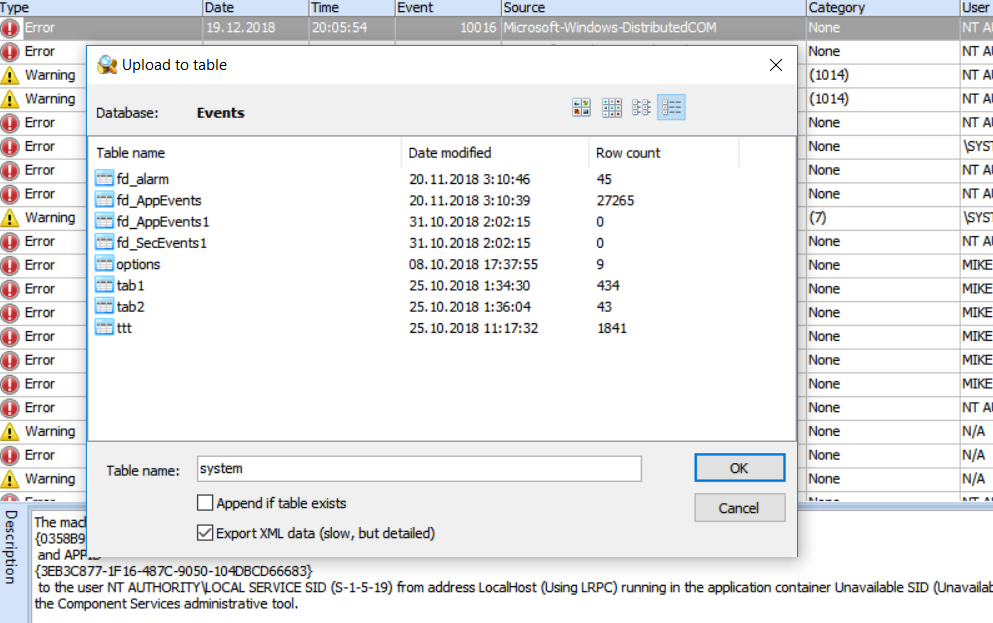
Saving events
Select Database -> Upload to table from the main menu.
Type table name in table name field
Enable option Export XML data if you want to get the most detailed information about event. Note that in this case, Event Log Explorer will extract XML information for each event and this may take a very, very long time. So, if you want to export XML data, we recommend using Event Log Database Export utility which comes with Event Log Explorer. I will describe this utility in another blog post.
Enable option Append if table exists if you want to add events to the existing table. In other case, if the table exists it will be overwritten.
Press OK to start uploading events.
Loading Events
To load events from the database table, select Database -> Load from table.
Select the required table from the list, then click OK.
Voila! Now you can work with the table as you work with a general event log.
Restrictions:
Custom columns are not available for database events at the time
Bookmarks are not available for database events at the time
When filtering using regular expression (RegExp option), you cannot type the regular expression in PCRE format, you should type your regular expression as SQL Server LIKE template. E.g. if you want to find in description all events about DCOM error with the error code 298, you may type your template as %Unable to start a DCOM Server%298%
Current version: version Released: date Supported OS: Windows All