

Recently we released a new product that collects events from different sources, sends them into a database and alerts on important events.
Elodea (acronym for Event Log Dispatcher and Event Alerter).
The program and its documentation are available on this page:
https://eventlogxp.com/elodea.html
In this article I will demonstrate how to setup and configure Elodea on your PC.
To simplify the demonstration process, we will work solely with a local computer. But you can use this experience when setting up Elodea in your network.
First, you will need to install Microsoft SQL Server.
Elodea supports all SQL Servers editions (starting from SQL Server 2008), so you may try even free SQL Server Express available at
https://www.microsoft.com/sql-server/sql-server-editions-express
You can use any Windows (server or workstation) starting from Windows Server 2008 (or Windows Vista).
Install SQL Server on your computer. You can setup it with the default installation options.
It is not necessary, but I would recommend to install SQL Server Management Studio (SSMS). SQL Server installer may prompt you to install SSMS or you can download it from
https://docs.microsoft.com/sql/ssms/download-sql-server-management-studio-ssms
Download Elodea and Event Log Explorer from
https://eventlogxp.com/download.html
Start Elodea installer by running file elodea_setup.exe
Follow the setup wizard steps. When the Setup prompts you to install Collector Service, select to install it under a User account and input your own Windows user name and password in the related lines.
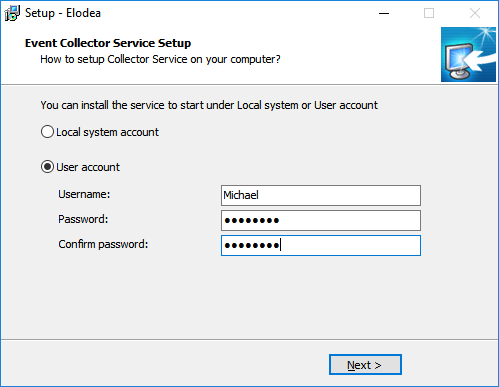
We will run the service under a user account because SQL Server Express by default enables only Windows user authentication and assigns the dbo rights to a user who installed the SQL Server.
Now you can configure Elodea by starting Elodea Event Collector Settings from Windows Start menu.
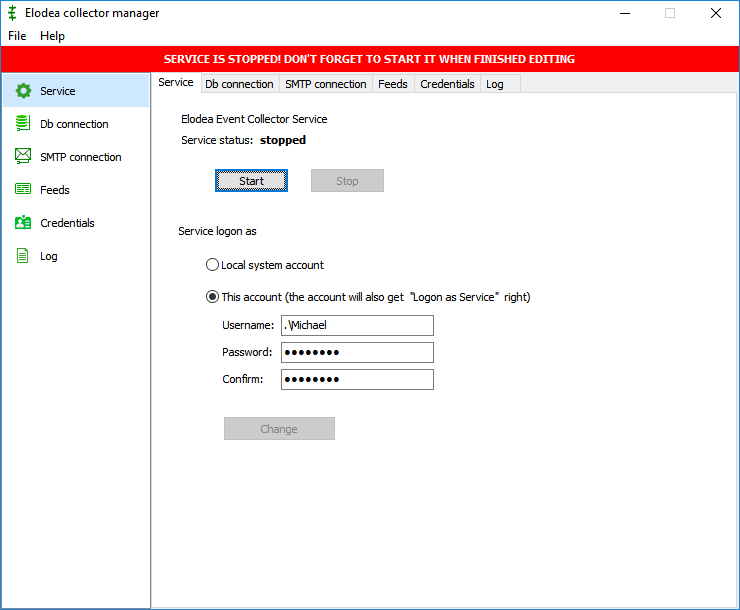
Review the Settings tab and make sure that the service not started. Switch to the Db Connection tab to configure database connection.
Input localhost\SQLEXPRESS into Db Connection (this is the default instance name for SQL Server Express on a local computer, you can also use COMPUTER_NAME\ SQLEXPRESS).
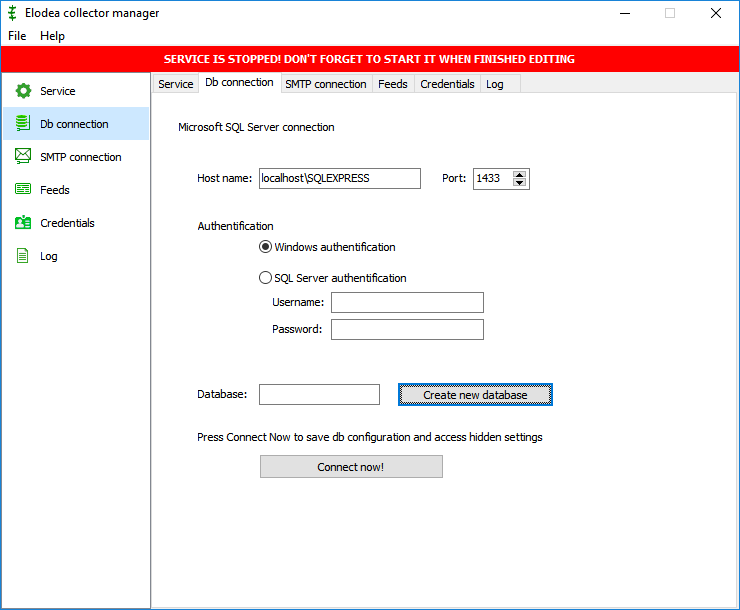
Click Create new database to create a new database. A new window will appear.
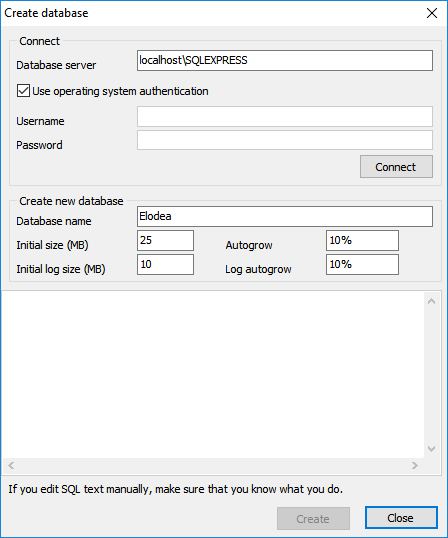
Click Connect button, type Elodea into the Database name, and then click Create button. You will see a message that the database was created, then this window will be closed and the program will connect to this new database.
Switch to SMTP Connection to set up connection to a SMTP server to receive alerts from Elodea.
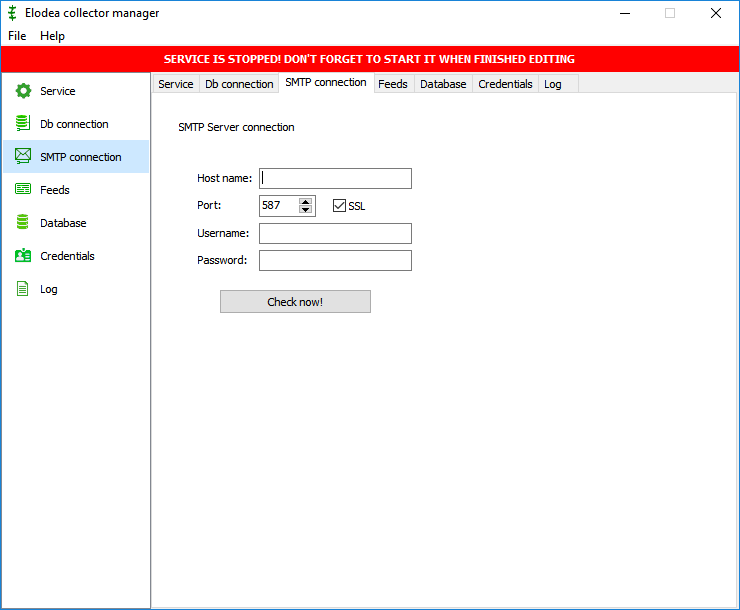
Type your SMTP server name, input SMTP port number and enable SSL connection if required. Enter your name and your password and then click Check now to verify connection and save your settings.
Switch to the Feeds tab.
Feed is a special Elodea entity that describes what events and from what sources will be collected by Elodea.
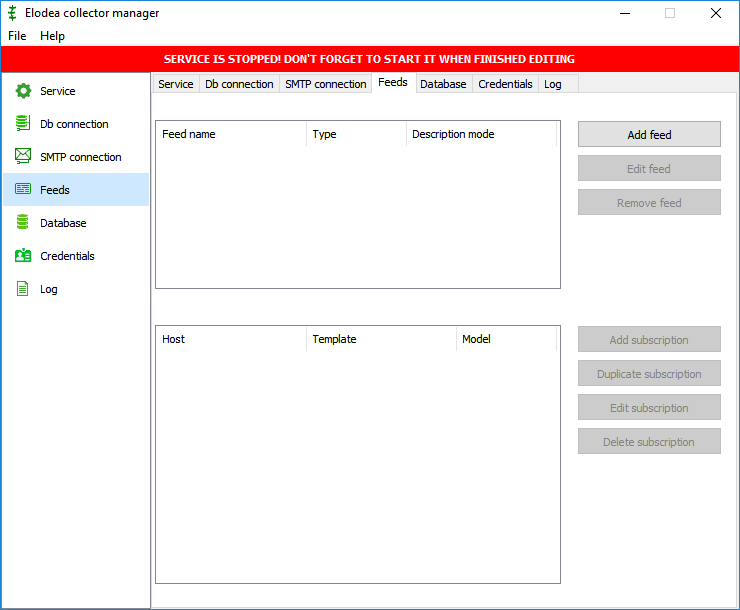
Create a feed for Application events by clicking on Add feed button.
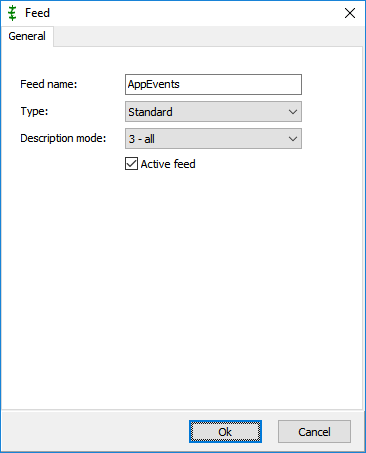
Type AppEvents into as feed name and change Description mode to 3 – all. Click Ok.
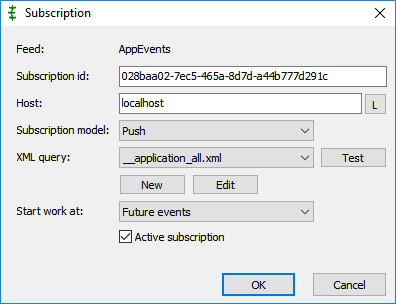
Then create a subscription in this Feed by clicking on Add subscription button.
Set Subscription model to Push and set XML query to __application_all.xml. Click Test button to verify the selected XML query is valid. Press OK button.
We created a Standard feed subscribing to all application events on a local computer.
Let’s create a feed that receive error events from Application and System logs and sends email notifications on errors:
Create Add feed button.
Type Errors into Feed name, change Type to Alarm and change Description mode to 3.
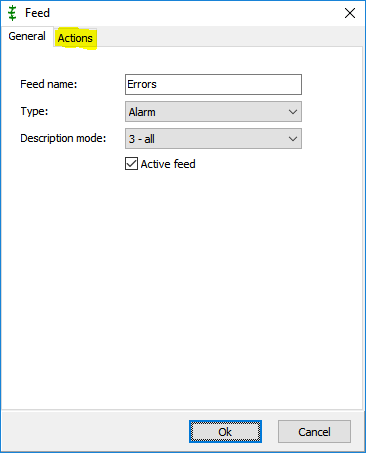
Note that a new type Actions appear in the top of this window. Switch to this tab.
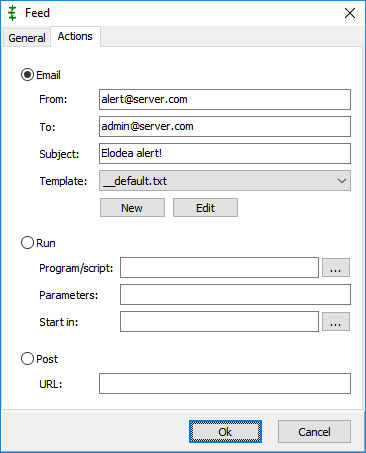
Select Email option, then input your email details into From, To and Subject fields. Make sure that addresses are valid. Set Template to __default.txt and click OK button.
Press Add subscription, set Subscription model to Push and set XML query to __application_system_error.xml, then press OK.
Now you have 2 feeds, AppEvents and Errors.
Let’s try it! Switch to the Service tab and click Start and make sure that the service status has changed to running. Make several events in the application log.
Open Windows Command Prompt and type commands:
eventcreate /id:1 /d:"test event" /t:Information
eventcreate /id:2 /d:"test event" /t:Warning
eventcreate /id:3 /d:"test event" /t:Error
eventcreate /id:4 /d:"test event" /t:Information 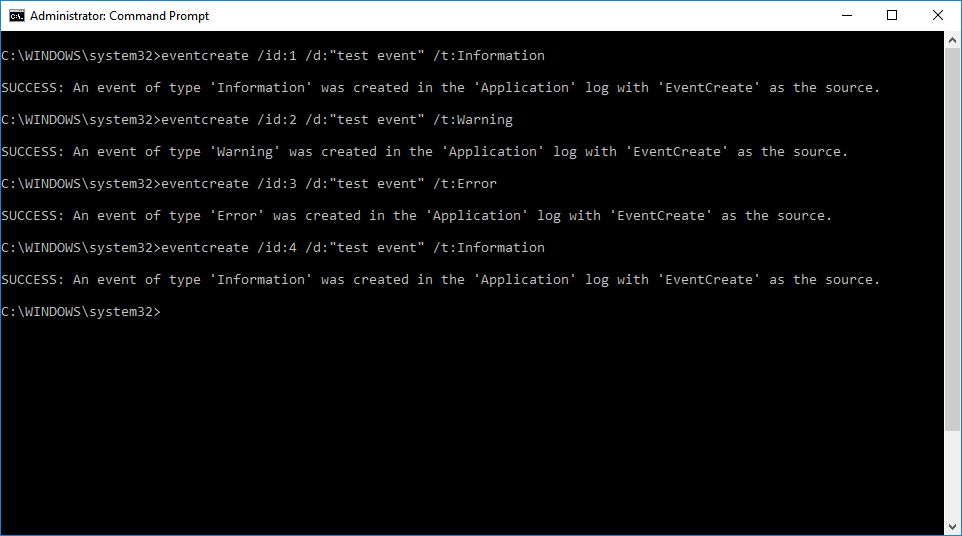
Let’s view what is in the database. You can check it using SQL Server Management Studio, but it is better to view the database using Event Log Explorer:
Start Event Log Explorer.
Select Database -> Connect from the main menu.
Enter localhost\SQLEXPRESS into Database server field, tick Use operating system authentication, type Elodea into Database name field, then click OK.
Now you can load tables. Select Database -> Load table from the main menu.
Select fd_AppEvents, then select Database -> Load table again and select fd_Errors.
2 tabs will appear in Event Log Explorer:
fd_AppEvents
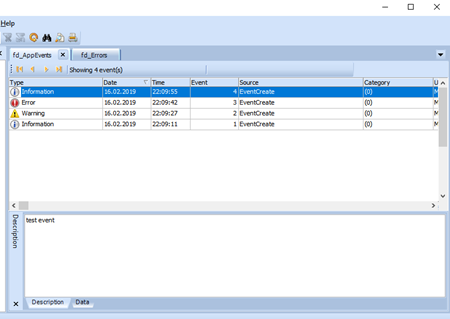
fd_Errors
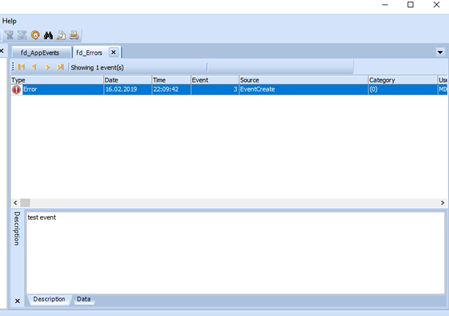
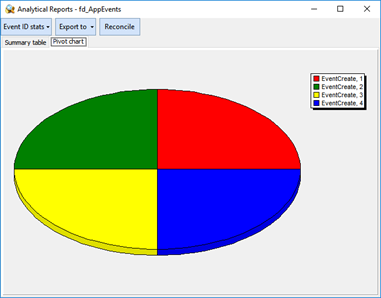
And you can work with these tables in Event Log Explorer as you work with a general event logs. E.g. you can run analytical reports for these events:
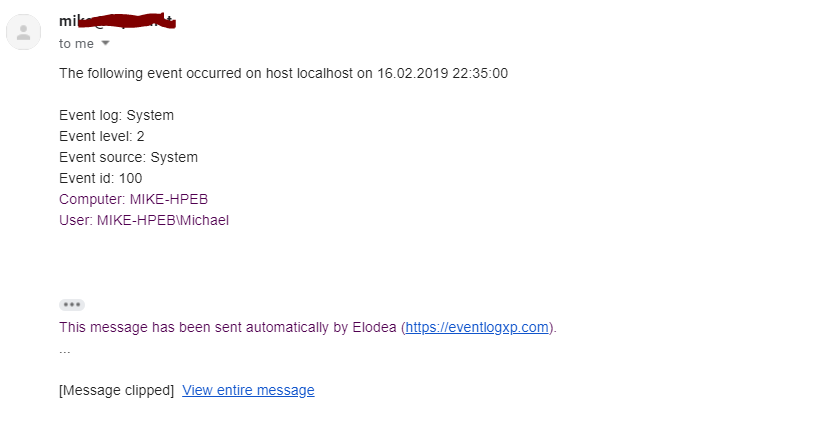
Error feed should also collect errors from the system log. Test it:
eventcreate /id:100 /d:"test event" /t:Error
/l:System
Verify email notifications:
Now you can quit Elodea event collector settings – the collector service will continue working all the time when your computer is on.


