

If you read the previous part of this article, you already know what Microsoft-Windows-Diagnostics-Performance log is for, why similar events have different event types and what information is “hidden” in the event details.
Now it’s time to practice. First, we need to decide what we will try to optimize. Let’s display only startup, shutdown and standby/resume events. The event IDs are 100, 200 and 300 respectfully. So let’s filter by event id = 100, 200, 300:
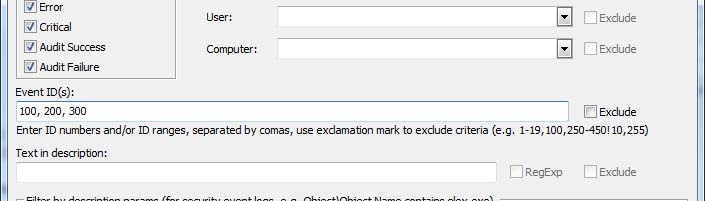
You can optionally switch warnings off in the filter to get error and critical events, but I will leave it checked.
Now we can view statistics of the events. Select Advanced from the main menu, click Analytical Reports. Then in the Analytical Report window click Report and select Event ID stats. I switched to Pivot chart for better view:
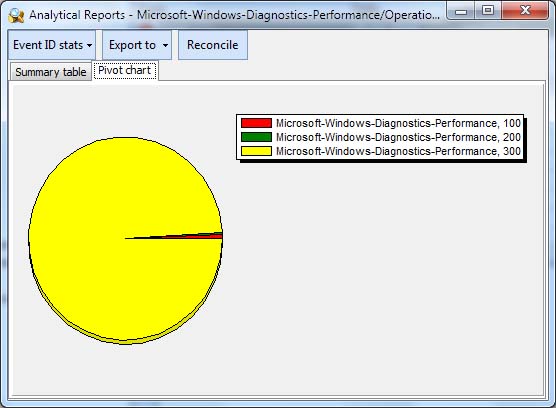
As you can see, I have just got a few Windows startup events in this log (and only 1 shutdown event). Most of events here are Standby/Resume events. There are several reasons for this – I switch off/reboot the computer very rarely, most of the time I use hibernate or sleep commands to switch off the computer. My primary drive is a SSD drive so I don’t have problems with prefetch at startup, so My PC commonly starts up in about 10 seconds. And I don’t have too many autorun programs or services.
However, I really have performance issues with hibernation and resume. So let’s check what the reason of such performance degradation can be. Event 300 contains lots of parameters (similar to event 100 described in the previous post), but they don’t describe the source of the problem. As you may remember, the details of the problems are listed in the events that follow the “basic” events. For standby/resume – they are 3xx. So let’s filter by event id = 301-399 (Note that if you troubleshoot boot up events, it will be 101-110 or 101-199).
![]()

We can build event ID stats diagram again (it is not necessary, but we may find out common reasons of the problems):
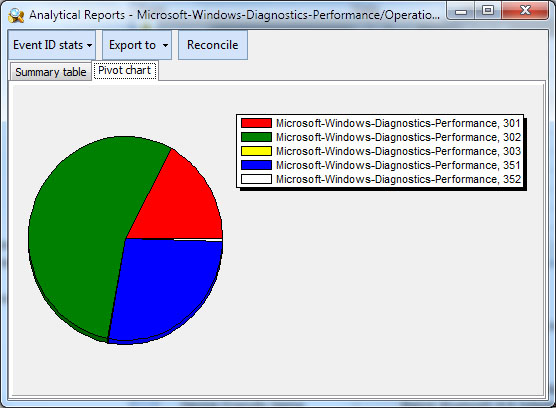
We can see that the typical reasons of the degradations are the device driver issues (302, 351) and application issues (301).
So, let’s concentrate only on these events: set event filter to Event ID = 301, 302, 351
![]()

Now we should somehow display the source of the problem. In this article, I showed how to use custom columns. Fortunately for all these events, the sources of the problem have the same sequence numbers:
3 – an application file name or a driver name
5 – friendly name of an application or a driver
11 – full path to an application or a driver.
These numbers you can get from the XML view of these events (double click on event and switch to XML).
I will use friendly name (but you should be aware that some applications may have no friendly name):
Go to View->Custom columns and add a new column from PARAM[5]:
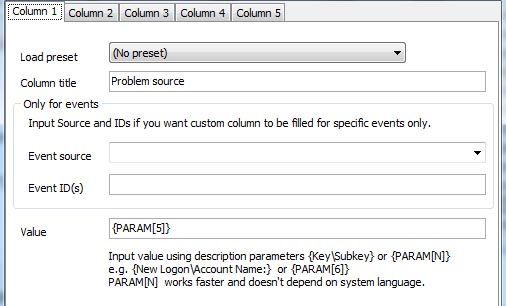
Now you can see the problem source as a column in the event list.
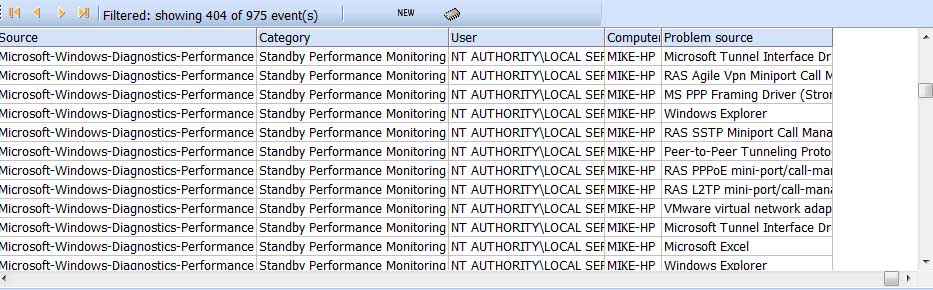
Let’s create a new pivot chart for this table, event log view to get statistics for “Problem source” column. Go to Advanced->Analytical reports. Then select “CustomColumn1 stats” from the Report menu.
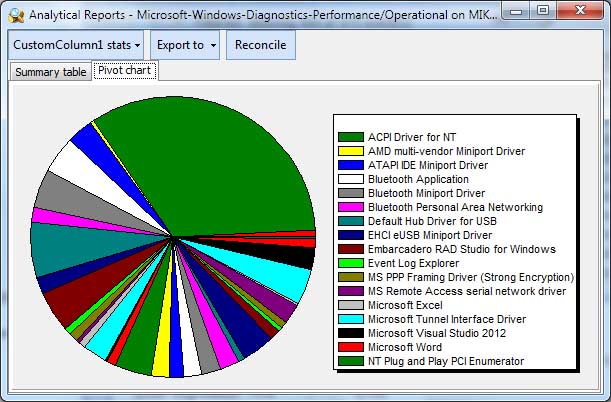
Now I can see that I should check if a new version of ACPI Driver for NT available (and I should pay attention to Default Hub Driver for USB and several other drivers and applications).
Although I could stop at this point, I will show one more way of detecting the sources of performance issues. When researching events 101+, 201+ and 301+, you can find two parameters under EventData. They are TotalTime and DegradationTime. Totaltime is the time in milliseconds it took for processing (time to initialize a service, start an application, unload application etc). DegradationTime is the time meaning how much longer than usual it took for processing. So, we can exclude some unnecessary events that took not too much time, but are in the list. Let’s display only events that took 300 or more milliseconds. Do not close the pivot chart, just switch back to Event Log Explorer window to set filter. In the article “Advanced filtering. How to filter events by event description” I mentioned about setting XML query filters using XPath syntax. Now we can use it to refine events. Select View->XML query and type
*[EventData[Data[@Name='TotalTime']>'300']]
In my case, the number of displayed events reduced 8 times. Switch back to Analytical Report window and click Reconcile button.
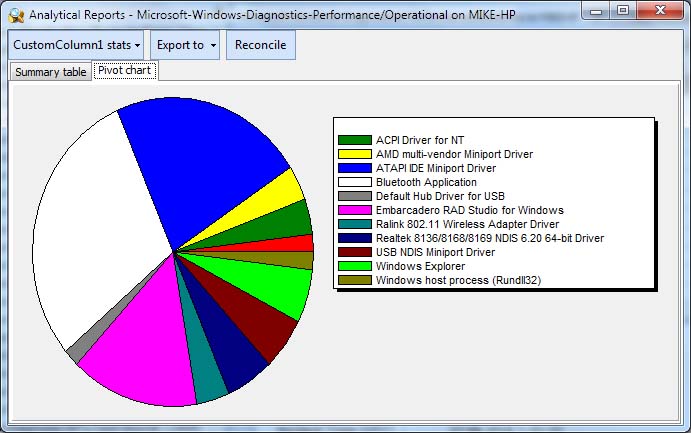
And we see a different picture – BlueSoleilCS and ATAPI miniport make contribution to the performance degradation.
I hope that not only you learned about Microsoft-Windows-Diagnostic-Performance events, but also got helpful information about the advanced usage of Event Log Explorer. The article covered several topics that our users often miss: XML view of an event, Analytical reports, custom columns and XML query filter.


