Monthly Archives: March 2016

Exporting event logs with Windows PowerShell

Do you need to automate error reporting based on recent events and don’t want to use third-party tools? This article describes how to collect events from different sources and unite them in one document using standard Windows instruments only.

Recently I described how to export events into Excel format using our Event Log Explorer software. However, in some cases, using third-party software can be impossible. This may happen if your company doesn’t have budget to purchase event log utilities, or such utilities are restricted by the company’s rules. In any case, the task of regular exporting the recent events from different machines into one legible file is still crucial. That’s why I will show how you can get the events from different Windows machines and export them into one file for further investigation.

Task

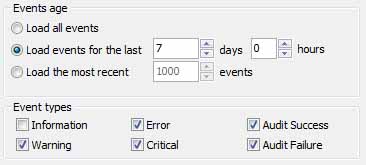
Let’s take the same task we solved previously. We have 4 Windows servers and we need to generate weekly reports of Error and Warning events in Application and System event logs. We should utilize only standard Windows instruments.

Instruments

Microsoft features Windows PowerShell as a framework to automate different administrative tasks and perform configuration management in Windows. My scripts require at least PowerShell version 3.0. If your PowerShell is outdated, you can update it by downloading Windows Management Framework from Microsoft’s site. To check PowerShell version simply type in PowerShell console:

$PSVersionTable.PSVersion

Getting Powershell version

In my case, PowerShell version = 3 which is OK.

Research

To access event logs, Windows PowerShell comes with Get-EventLog cmdlet:

Parameter Set: LogName
Get-EventLog [-LogName] <String> [[-InstanceId] <Int64[]> ] 
[-After <DateTime> ] [-AsBaseObject] [-Before <DateTime> ] 
[-ComputerName <String[]> ] [-EntryType <String[]> ] 
[-Index <Int32[]> ] [-Message <String> ] [-Newest <Int32> ] 
[-Source <String[]> ] [-UserName <String[]> ] [<CommonParameters>]

First we need to define the start date (the date after which we will get events). This date is calculated as today minus 7 days:

$now=get-date
$startdate=$now.adddays(-7)

Now we can read warning and error events from a log for the last week:

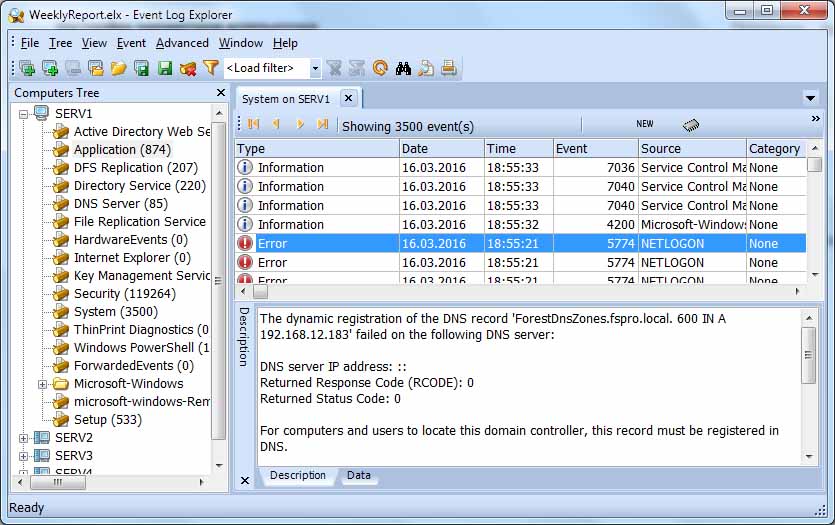
$el = get-eventlog -ComputerName Serv1 -log System -After $startdate -EntryType Error, Warning

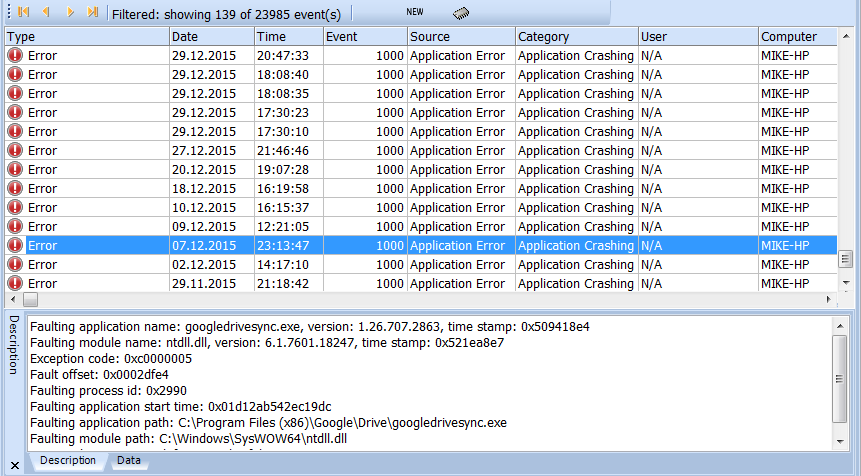
Let’s check the result. Just type $el in the console. Yes, we can see events from the event log.
But how will we export the event log? Windows PowerShell doesn’t have cmdlets to export to Excel. But it supports export to CSV file. Let’s try it now:

$el | export-csv eventlog.csv

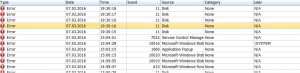
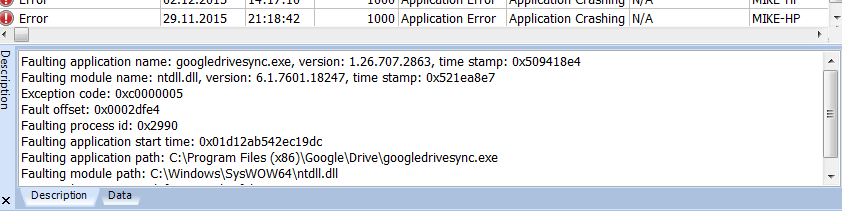
Yes, it works, but multi-line descriptions ruined the output file.
Maybe export to XML will help?

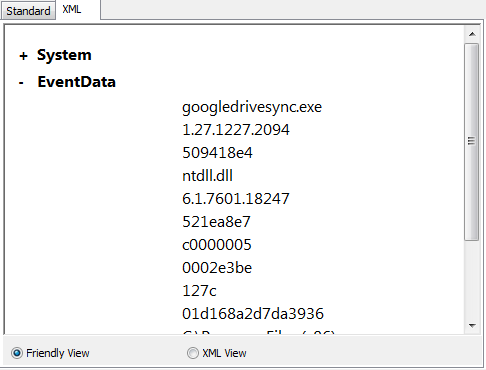
$el | export-clixml eventlog.xml

But how to display it in clear way? Excel understands XML files, but I have no idea how to interpret it:

PowerShell Log to XML

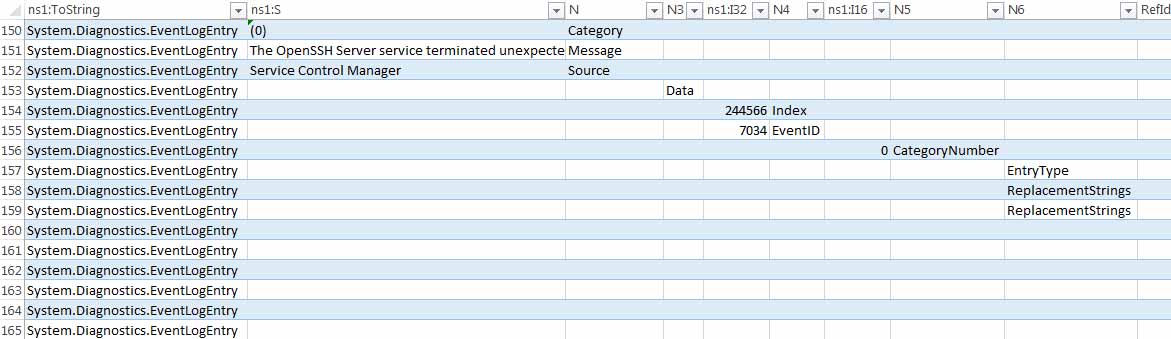
I guess we can make an XML transformation to convert this XML into more readable file, but I’m not an XML guru, but I have a more or less useful solution. We can solve our problem if we just export to CSV only several event properties (without event description):

$el |Select EntryType, TimeGenerated, Source, EventID | Export-CSV eventlog.csv -NoTypeInfo

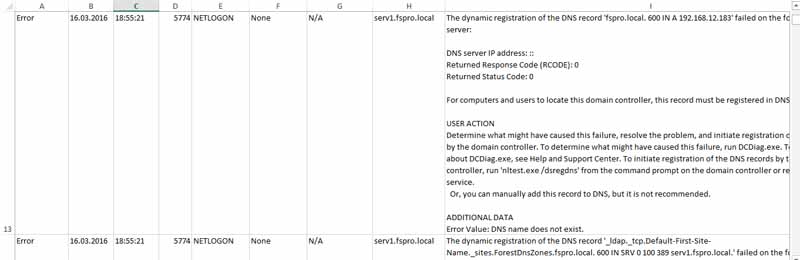
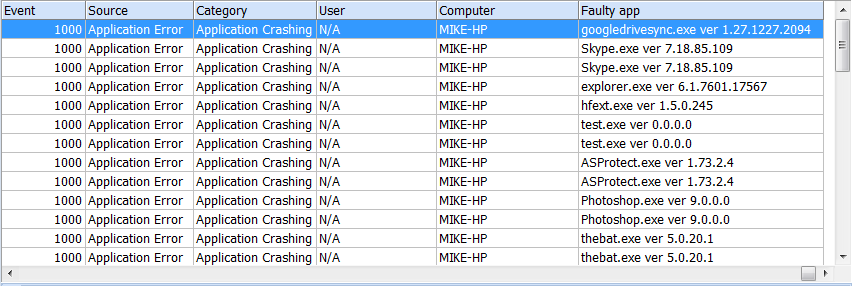
Now we can read eventlog.csv in Excel without problems.

Putting all together

It’s time to write the PowerShell script.
Brief: we will read recent (7 days) error and warning events from Application and System event logs, join them, sort them by time and export to CSV format.

#
#  This script exports consolidated and filtered event logs to CSV
#  Author: Michael Karsyan, FSPro Labs, eventlogxp.com (c) 2016
#

Set-Variable -Name EventAgeDays -Value 7     #we will take events for the latest 7 days
Set-Variable -Name CompArr -Value @("SERV1", "SERV2", "SERV3", "SERV4")   # replace it with your server names
Set-Variable -Name LogNames -Value @("Application", "System")  # Checking app and system logs
Set-Variable -Name EventTypes -Value @("Error", "Warning")  # Loading only Errors and Warnings
Set-Variable -Name ExportFolder -Value "C:\TEST\"


$el_c = @()   #consolidated error log
$now=get-date
$startdate=$now.adddays(-$EventAgeDays)
$ExportFile=$ExportFolder + "el" + $now.ToString("yyyy-MM-dd---hh-mm-ss") + ".csv"  # we cannot use standard delimiteds like ":"

foreach($comp in $CompArr)
{
  foreach($log in $LogNames)
  {
    Write-Host Processing $comp\$log
    $el = get-eventlog -ComputerName $comp -log $log -After $startdate -EntryType $EventTypes
    $el_c += $el  #consolidating
  }
}
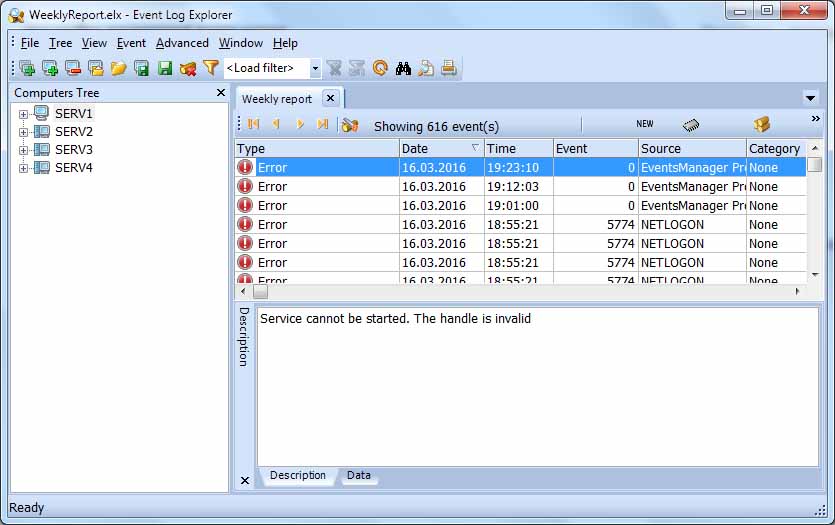
$el_sorted = $el_c | Sort-Object TimeGenerated    #sort by time
Write-Host Exporting to $ExportFile
$el_sorted|Select EntryType, TimeGenerated, Source, EventID, MachineName | Export-CSV $ExportFile -NoTypeInfo  #EXPORT
Write-Host Done!

Scheduling the task

To run the script, we should run this command:

PowerShell.exe -ExecutionPolicy ByPass -File export-logs.ps1

We can open Windows scheduler GUI to make this task, or use PowerShell console:
Microsoft recommends this way to schedule a PowerShell script:

$Trigger=New-JobTrigger -Weekly -At “7:00AM” -DaysOfWeek “Monday”
Register-ScheduledJob -Name “Export Logs” -FilePath “C:\Test\export-logs.ps1” -Trigger $Trigger

But this may miswork, because it adds to Windows Task Scheduler the following action:

powershell.exe -NoLogo -NonInteractive -WindowStyle Hidden -Command “Import-Module PSScheduledJob; $jobDef = [Microsoft.PowerShell.ScheduledJob.ScheduledJobDefinition]::LoadFromStore(‘Export Logs’, ‘C:\Users\Michael\AppData\Local\Microsoft\Windows\PowerShell\ScheduledJobs’); $jobDef.Run()”

If your policy prevents running PoweShell scripts, our export script won’t run because powershell parameters miss -ExecutionPolicy option.
That’s why I will use ScriptBlock instead of FilePath. This code does the trick:

$trigger=New-JobTrigger -Weekly -At "7:00AM" -DaysOfWeek "Monday"
$action="PowerShell.exe -ExecutionPolicy ByPass -File c:\test\export-logs.ps1"
$sb=[Scriptblock]::Create($action)
Register-ScheduledJob -Name "Export Logs" -ScriptBlock $sb -Trigger $trigger

Note that to run Register-ScheduledJob cmdlet, you need to start PowerShell elevated.
That’s all. Now you should have a task that runs every Monday at 7:00, collects events from your servers and exports them to CSV files.

Conclusion

As you can see, the problem of exporting events to Excel can be solved without third-party tools. This method is somewhat limited, but it works.

Facebooktwitterredditpinterestlinkedinmail

Case study – generating regular reports about the problems in your Windows network

Recently one of our clients asked us about the best way to organize a passive monitoring of their servers. The client told us that they don’t need to monitor the servers actively, but they want to have weekly reports about the problems. They tried to gather events using Windows PowerShell and export them to CSV format (to view events in Excel), but finally they gave up.

Task

The customer reported that he is a system administrator of a network with 4 Windows 2008 Severs and he needs to check out only system and application event logs of these servers. Ideally, these machines should generate only information events (no error or warnings). He would like to have reports of the problems in the beginning of every week.

So we can reformulate the task as follows:

Generate weekly report of all non-Information events in Application and System logs.

Our solution

First of all, we suggest to start a new copy of Event Log Explorer and create a new workspace for this task (use File->New workspace command). You can ignore this suggestion, but we recommend to always separate long-running tasks (like active monitoring or scheduled tasks) from operative event log tasks.

Then we need to add the required servers to the tree. This can be done either with help of Add Computer Wizards or manually (by pressing Add computer button).
Servers added

It’s time to create our log view. We will consolidate all the application and system logs from these servers in one view.

Open Serv1 server in the tree and double click on System log to open in.
Open system event log on server SRV1

We can subsequently add other event logs to the view, but it is better to set on-load filter first.  Go to View->Log Loading Options, select Load event from last 7 days (we need a report for the last week) and untick Information type.
log loading filter - (no information, last week)

Now we can add other logs to the view and they will be filtered automatically:

Right click on Application log of Serv1 and select Merge with the current view. Open Serv2, Serv3 and Serv4 and continue to add their application and system logs to the view.

Click on Date column to sort all merged events by date and time.

Rename unclear “Merger” name to something better: select View->Rename and change the name to “Weekly report“.

Now you should get something like this:
consolidated event logs

Let’s automate this.

Select Advanced->Scheduler from the main menu and create a new task. Name the task as “Problem Report” and click Next.

Set when we want to run the task, e.g. on Mondays at 7:00:
Event log scheduler

Click Next and select what we want to do: Refresh, then export:
event log - export to excel

We will export to Excel 2007 format with event descriptions.

Leave “Export path” with the default value “%USERPROFILE%\Documents” which means that Event Log Explorer will save reports in Documents folder of your user profile (note that in Export path you can enter any Windows path, including UNC paths, so it lets you store reports on remote computers).

Click Next, then Finish and then OK in Scheduler window.  Now you can save the workspace (File->Save workspace) and minimize the application (you can minimize it even into the notification area).

That’s all. On Monday at 7:00 AM, Event Log Explorer will load error and warning events for the last week from the servers and export these events into XSLX file:
exported to excel eventlog

And even if you close the program or restart your PC, you can always run Event Log Explorer and open your workspace – this will load all your settings and restore the scheduler.

Conclusion

As you can see, tuning Event Log Explorer didn’t take a lot of time (I did it in just 4 minutes), and what is more important you will have regular reports about problems from different sources without extra work! Needless to say that you can easily modify event filters to fulfill your specific requirements.

Facebooktwitterredditpinterestlinkedinmail

Troubleshooting knowledge base

Some of us have dealt with the frustration of dealing with a problem we know we’ve experienced before, but didn’t register it properly.

The outcome? We do it all over again, and basically, waste time and past effort. A good record of an analysis and key events can save a lot of time.

Most of the internal knowledge bases used by companies, small and large, have the same basic and fundamental building block: they aim to map a set of keywords to a specific issue and it’s solution.

How could this work for you, and how does this relate to the windows log file?

Quite simply, you can build you own Knowledge Base, using the event information you are analyzing.

If you are looking at a windows log file, either something is wrong, you are careful and do regular check to prevent problems, or you are interested in understanding the flow of events in your operating system (also, you have quite a bit of time on your hands).

I will assume you are with the majority, you are looking at a windows log file because something is wrong.

Something you will find very useful in the future is a clear description of the problem, and its solution. If it never happens again, great! But if it does, you will at least know what you did to solve it. You can even learn that your solution wasn’t the best, and that is why it happened again, therefore it’s a good time to review that solution.

A good method for taking record of issues using windows log file analysis involves choosing the words that describe the problem, and choosing the events ID to associate with that problem.

The best way to illustrate this is a real-life experience:

A SQL Express database has maximum size of 10GB.

When full, it stops and an error is logged.

The vCenter software (installed in Windows 2008) uses a SQL Express database by default, and has a defined number of days to keep history, etc, all thing that can lead to the use of the 10GBs

When vCenter fails, the error is not registered as an SQL database error, but as a SQL connection error.

The first time you solve such problem, which is actually simple to solve, you must shrink the Database or move the database to a full SQL server, you need more time to understand what’s really causing the issue, For you, the issue isn’t called “SQL Express problems”. The issue is called “can’t access vCenter”. How do we relate both?

The easiest way is to actually tell a story, explain in detail what you are seeing and how you are interpreting it, what events you are analyzing, and what actions you are taking.

After you solved the problem, you should review all the information, organize it, and make sure it is accurate and easy to understand. You should by now have a good description of the issue, with some key words or sentences associated with it, and the event IDs and details that were important to the solution.

For the issue in my example, I would have a Knowledge base entry named “Can’t access vCenter” with associated tags “database access, SQL Express, database limit, windows 2008, connection error” and in the description of the entry I would have all the events that were relevant in my investigation, and the detailed description of my investigation. I would also provide links to external articles and eventually some cases in which the events would lead up to different issues.

Having a solid documentation of this issue means that in the future, if this happens again, I can just lookup the work vCenter, find this article, verify that the events in the windows log files are the same, and would solve my issue quickly based on the past experience.

Also quite important is the possibility of contributing to the community that helped you in the past. That forum entry of a person having just the same issue as you, and that helped you with the solution, was written by someone who actually documented what happened. The more everyone contributes the more everyone profits from the solutions available.

And what can be more accurate than a good windows log file analysis with concrete consequences and actions? A specific event is the same in all computers with that same Operating System.

If you spend 30 minutes documenting a solution that would take you 1 hour to accomplish, don’t think you wasted 30 minutes, think that you earned 3 hours if this problem happens 3 more times.


Facebooktwitterredditpinterestlinkedinmail

Forensics and Benford’s Law

As a producer of digital forensic software, we are regularly learning more about forensic methods and tasks. Recently I came across a curious article (and video) in Business Insider called “How forensic accountants use Benford’s Law to detect fraud

The video states that forensic guys can use Benford’s Law to analyze financial data and identify red flags.

This sounds interesting because it is too easy to check if a set of data obeys this law. Let’s do some checks.

Benford’s Law is a phenomenological law about the frequency distribution of leading digits in many real-life sets of numerical data. Mathematically it can be written asbenford law for forensics - formulad – the leading digit
P(d) – probability that a number begins with d.

For d from 1 to 9, we can calculate probabilities as follows:
Bendord Law for forensics - original chart

It is stated in the article that Benford’s Law works good for values which are results of multiplication, division and raising to a power, which are common for financial calculations.

Microsoft Excel helps us to verify this with no efforts. I will multiply 2 random values and divide it to another random value: RANDBETWEEN(1,99)* RANDBETWEEN(1,99)/ RANDBETWEEN(1,99)

and calculate the distribution for 500 values.

benford law for forensics - random values
Great! This really looks like Benford’s Law distribution. And this may really help in forensic investigation when analyzing calculated values. If you are interested how I extracted the first digit from a number – it’s very easy:
NUMBERVALUE(LEFT(TEXT(A2,0),1))

But the article’s video starts from the statement that the population of every US county obeys to this law as well. Although I understand, that we can predict demographic values using math formulas, this sounds weird. Since the population of US obeys to this law, I guess this should work for the world population. Let’s check it.

I was skeptical about the result, but it really looks like Bedford’s Law distribution!

benford law - world population
Ok, if it works with population, maybe it will work with similar entities, but specific to digital forensics. First, I thought about event logs, e.g. number of events in the log. But obviously it won’t work, because event logs are limited by size. In my example, when the event log grows,  the first digit will be always ‘2’ till you clear the log.

Event logs limited by size
Moreover, Windows commonly uses only few event logs, so we won’t get any statistical significance. And of course Benford’s Law won’t work if we test Event ID numbers – they have solely artificial nature and it’s up to developer to choose an identifier for event.

But what about files. What if we test it with file size – will it work? If it works for test samples, we will be able to suppose that if the investigation case  files don’t obey the law, someone could remove many files. I will test it with C:\Windows folder and its subfolders on my PC (it contains more than 100 000 files). By the way, since Windows keeps event log files in C:\Windows\System32\winevt\Logs and these files are limited by size, it may affect the statistics. Hopefully there are only about 150 files in Logs folder, so this effect is not significant. We will take size of every file in kilobytes.

benford law for forensics - files sizes in Windows folder
Well, it is really similar to Benford’s Law distribution. But one sample is not enough to make conclusions. It is interesting that in all my cases, we can see a small hump at 7 or 8 digits.

Let us summarize what we researched here. Benford’s Law works for big volumes of data that are the result of certain calculations, like financial results. It works with some statistical data. It may work for some specific digital data – although my test shows that it works for file size, it should be rechecked with other sets of data. Probably it will work with other digital data which digital forensic investigator may get as evidence. However this method won’t work for neat frauds. If only a small part of data modified, the distribution won’t show any significant deviation. In case of financial fraud, if a malefactor modified the original data and recalculate all the results, I suppose that the new set of data will obey the law.

Therefore, as any forensic instrument, Benford’s Law has its own applications, but it is not a panacea.

Facebooktwitterredditpinterestlinkedinmail

Troubleshooting philosophy – Windows event log error analysis

There are different circumstances that lead to an event log analysis. One of the most common is the reactive Windows error log search, “reactive” because it is done in reaction to a problem, “error log” because what we are looking for error events that will help us identify the origin of the problem. When searching the error log entries (error events in Application and System logs), it can be difficult to establish a direct relation between the problem being experienced, and the error event itself.

Normally the events are analyzed after the problem occurs. One of the most frequent actions when troubleshooting is filtering the same event to correlate it with past problems.

There are distinct cases in wich this is helpfull:
– This particular problem never happened, and the event never appeared, there is a high probability that the event is related to the problem.
– This particular problem has happened before but the event never appeared, there is low probability that the event is related to the problem.
– The event is much more frequent than the occurence of the problem or the problem never happened and the event is seen frequently, there is a low probability that the event is related to the problem.

In search of events logged due to an error, filtering out the “noise” is a very big step in finding the right events to analyze.

Filtering event noise
After finding a windows error log entry that we think is most likely related to the problem, some before and after events should also be analyzed, even if they are warnings or informational log entries, they can be related to the error.
Frequently a sequence of events is observed when doing a deeper analysis of windows logs (not only checking for error events), for example, a warning that a service did not respond, followed by an information that the service is restarting, a warning like a problem loading a dll, the occurrence of the error, and an information that the service successfully started.

The events before and after the error seem related to the error itself, and we now know that there is probably an issue with a dll and also with a service, and both can be related to the error.

Doing a Windows error log analysis can be difficult due to the amount of information found, and there is a risk of losing focus on the search for that event that will lead to the solution.

Troubleshooting Errors
As stated above, filtering and carefully choosing the events to concentrate the investigation will help.
A clear case to exemplify the importance of such method is the classical “solve one thing, break another” that can happen when, by taking action trying to correct some issue that you discovered existed by the presence of that windows error log, you change the environment in a way that your original error manifests itself in a different way or with a different frequency, and if repeated, this action (fixing an error different from the original) can lead to cascading events that will certainly drive you further away from effectively solving the original problem.

So, doing the research, one should ignore (during the course of a particular analysis) other non-related or not critically related errors that are encountered.

In addition, circumstances can change after the manifestation of the problem, which leads to different event entries after a reboot, with the specific software or hardware component still failing, but being registered as the Windows error log entry in a different way.

A remediation should be considered many times as a per-round iterative process, in which we detect an issue, find evidence that leads to a potential solution, test the solution, and restart the process/Operating System.
In a truly complex investigation of an issue and its related entries in the Windows log, it is also useful to build a chain of events. A chain of events is best built if we are sure that certain events are related in a defined sequence, and none of them appears regularly unrelated to the error event we are focusing on. It might be necessary to eliminate intermediate events which are unrelated to the issue being analyzed, and due to the large number of events that are logged, can appear registered between two events which are part of the chain of events we are analyzing.

After a problem has been truly understood, it can be replicated, in which case the chain of events would also appear to prove it was exactly the same problem.

Facebooktwitterredditpinterestlinkedinmail

Once again about custom columns – extracting details from Application or System event logs

In my article “Exploring who logged on the system“, I described how to add to the event list custom columns that display data from the event description. Probably you might think that adding custom columns works for Security event logs only. Although we initially designed Custom columns feature exactly for Security logs (and referred them by name, e.g. Subject\Account name), we made it possible to use it with any logs.

Let’s take a typical system engineer or administrator task to discover faulty applications on the system. We will search for application error events. Such events are stored in Application event log, event source is “Application Error” and they are commonly registered with Event ID=1000. Therefore, we need to open Application log, and refine its events:
application error (event 1000)

Application error filtered

We can see that the description of event 1000 is not so well-structured as descriptions in Security log:
App error description

so it is impossible to refer description parameters by name.

However, we can still refer these parameters by number as {PARAM[x]}.

Look at the event description. The application name and its version is in the very beginning:

Faulting application name: googledrivesync.exe, version: 1.27.1227.2094, time stamp: 0x509418e4

Most likely, we will refer app name as PARAM[1] and its version as PARAM[2], but let’s make sure.

Double click on an event to get Event Properties and switch to XML tab.
app_error_XML

Yes, we can see that googledrivesync.exe 1.27.1227.2094 are the first and the second parameters respectively.

In this example, I will display app name and version number in one column as googledrivesync.exe ver 1.27.1227.2094, but you can try 2 columns (for name and version #) or get rid of version number at all.
Open Custom columns dialog (View->Custom columns).
App error custom columns

Title the column as Faulty app
Leave Event source and Event ID(s) blank (your log is filtered).
Set Value to {PARAM[1]} ver {PARAM[2]}
Press OK and enjoy the result!
Application error with custom column - final

Facebooktwitterredditpinterestlinkedinmail