Monthly Archives: May 2016

Automating event log backup

Recently we received a question from our customer who asked about regular backing up of system and application event logs. He wanted to backup only local logs, but let’s extend the task for remote logs as well. So our task is to backup System and Application event logs from a local computer and remote machine (SERV1) into a folder two times a week.

Let’s try to do it using standard tools. Windows event viewer lets you backup event log – there is a command in Event Viewer – “Save all event as” and you should save them into evtx format. However, it doesn’t allow you to backup an event log from a remote server to a local computer or visa-versa.  You will get a message:

An error occurred while Event Viewer was saving a log file in .evtx format from SERVER to PATH.
Events from the remote computer cannot be saved into .evtx format files on the local computer. If you want to save the events to the local computer, select a different file format. To save the events in .evtx format, save them onto the remote computer.

Why this happens? Windows Event Log Service (eventlog), which is responsible for all main event log functionality is running under LocalService account. LocalService presents anonymous credentials on the network, so it has no permissions to backup event log anywhere, but computer on which the service is running. The same limitation has wevtutil.exe command. It works with local event logs only.

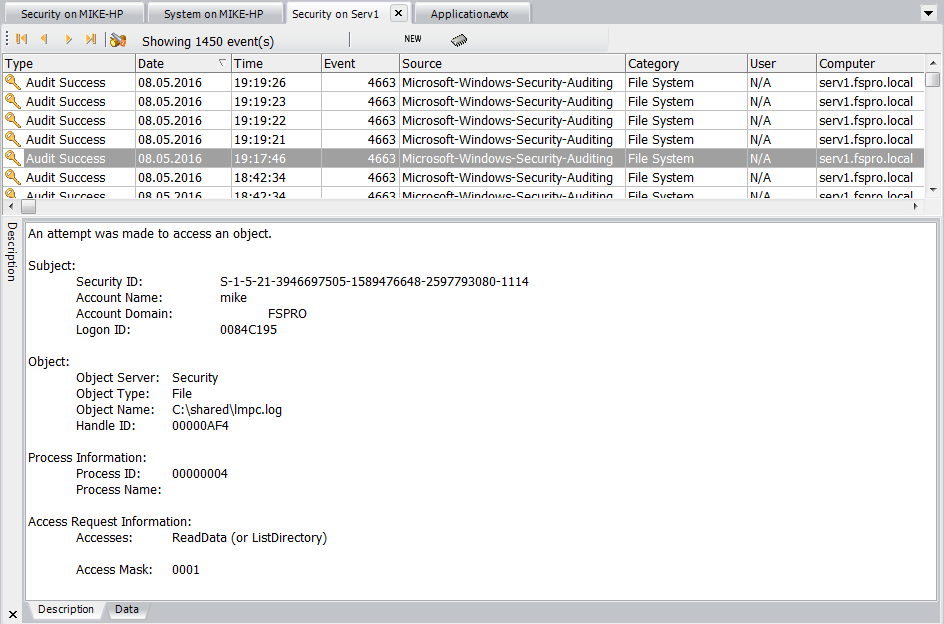
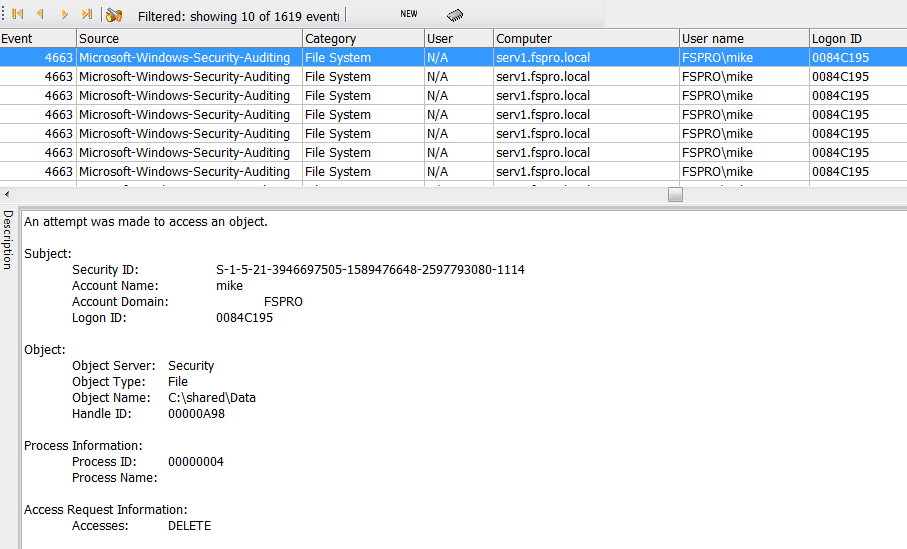
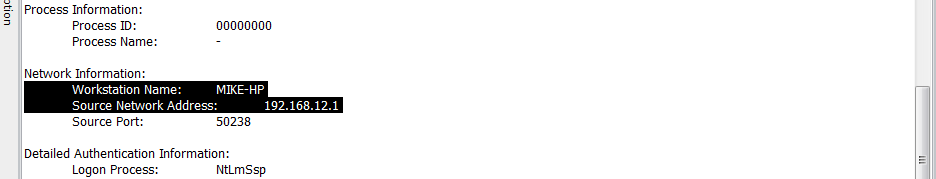
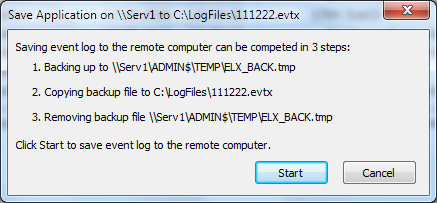
What about Event Log Explorer? We designed Event Log Explorer to backup remote event logs as easy as local ones. When backing up a remote logs, it saves the log into a shared folder on a remove computer and then moves it into the target folder.

Just click right mouse button a log you wish to backup in the tree and select Save log as. Event Log Explorer will do the rest.

event log explorer backup

Note that you must have administrative permissions on the server Serv1 or you won’t be able to access files from ADMIN$ resource.

Of course, you can backup event logs manually, but our user asked us to automate process. Event Log Explorer comes with ELBACK utility which can be located in the application folder (default location is “C:\Program Files (x86)\Event Log Explorer\elback.exe”). This utility developed exactly for batch backup of event logs. Detailed information about this utility available in Event Log Explorer help.

Here is our command line to backup Application and System logs from a local PC and Serv1:

elback.exe D:\backup Application System \\Serv1\Application \\Serv1\System /clear

Remove /clear option if you don’t want to empty log automatically after backup.

Run this command to test it. If it works correctly, you will see 4 new files in D:\Backup folder that looks like Serv1-System-2016-05-18-10-56-056.evt.

Now we can automate the process. I will use Windows Scheduler. In article Exporting event logs with Windows PowerShell I described how to create Windows Scheduler task with PowerShell. Here I will just use Windows UI for this.

Click Windows Start button, then All Programs->Accessories->System Tools->Task Scheduler
Select Task Scheduler Library in the tree.
Create Basic Task from the menu.
Give any name to the task, e.g. “Logs backup”.
Click Next.
On Task Trigger page select Weekly.
Click Next.
Specify when you want to run the task.
Click Next.
Select “Start a program”
click Next.
In Program/Script line type
“C:\Program Files (x86)\Event Log Explorer\elback.exe”
In Add arguments type
D:\backup Application System \\Serv1\Application \\Serv1\System /clear
Click Next
Click Finish.

Now you can find your task in the list.
Click right mouse button on the task and select Run to test it.
Check “D:\Backup” folder if new evtx files appear.

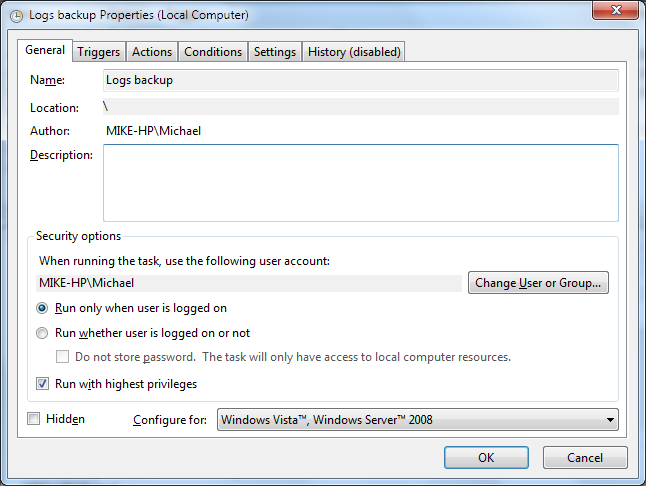
Important note: if you decide to backup a local Security event log, you will probably need to elevate permissions to access the security log. To do so, click right mouse button on Logs backup task in Windows Scheduler and select Properties. In the Properties dialog enable checkbox “Run with highest privileges”.

Scheduling event log backup

Don’t forget to the task before going production.

Facebooktwitterredditpinterestlinkedinmail

Tracking down who removed files

Let’s assume you have a shared folder on a server which is accessible by all employees in your company. The users commonly copy some documents into this folder to let the others to work with these shared documents. One day you discover that some files unexpectedly disappeared from the shared folder. Usually this means that someone deleted these files (consciously or unconsciously). Now we need to detect the person who removed the files.

First, you need to setup Windows security auditing to monitor file access (and optionally logon) events. Of course, you should do it right after creating a shared folder and granting access to it (post factum setup won’t help you) . This article describes how to setup security auditing and audit file access and logon events.

If you correctly setup file access auditing for your shared folder, “File system” events will appear in Security log on every attempt to open file inside the folder.

file system auditing

So be sure that the maximum log size for Security log is set to a reasonable value (or you have a chance to lose old events). Microsoft recommends 4GB for most of Windows, but this depends on different factors – I prefer much smaller sizes with autobackup option.

Event 4660 occurs when someone removes a file or a folder. But its event description doesn’t contain the file name:

An object was deleted.

Subject:
            Security ID:                  S-1-5-21-3946697505-1589476648-2597793080-1114
            Account Name:                 mike
            Account Domain:               FSPRO
            Logon ID:                     0084C195

Object:
            Object Server:   Security
            Handle ID:        00000AC8

Process Information:
            Process ID:       00000004
            Process Name: 
            Transaction ID: {00000000-0000-0000-0000-000000000000}

In fact, when a user deletes file, Windows registers several events: 4663 and then 4660. It can also register event 4656 before 4663).

Here is a sample of 4663 event description:

An attempt was made to access an object.

Subject:
            Security ID:                  S-1-5-21-3946697505-1589476648-2597793080-1114
            Account Name:                 mike
            Account Domain:               FSPRO
            Logon ID:                     0084C195

Object:
            Object Server:   Security
            Object Type:     File
            Object Name:     C:\shared\Data\_DSC9978.JPG
            Handle ID:       00000AC8

Process Information:
            Process ID:      00000004
            Process Name: 

Access Request Information:
            Accesses:        DELETE
            Access Mask:     10000

You can notice that “Access Request Information” group contains Accesses: DELETE and Access Mask: 10000 parameters.

So we can just filter security event log by Event ID = 4663 and Access Request Information\Accesses = DELETE (and if you enabled auditing for several folders, but want to check a specific one, you should also add filter by Object\Object Name):

event 4663 - filter deleted events

Now we can see all “file delete” events with file names.

This method works most of time, but I wouldn’t call it perfect. First, nobody guaranty that Accesses will be DELETE all the time (although you can try Access Request Information\Accesses Contains DELETE). Second, 4663 event occurs on access attempt. In some cases, e.g. if your file is protected, event 4660 won’t appear. So to get more accurate picture, we should rely upon 4663 events and get details from the previous events. Event Log Explorer features Linked Filter, which allows you to link events in security log by description parameter. Look again at 4660 and 4663 event samples. You can link them by Object\Handle ID parameter. Note that Linked Filter scans events from top to bottom, so make sure that you sorted events from new to old (our base event will be 4660).

linked filter - events 4660-4663

Here I got the same result as before.

Now you can just display who deleted files. Event description keeps these details in “subject” group. I will use custom columns to show these details in the list:

custom columns-deleted files

Here is the result of adding custom columns:

showing-users who deleted files

You probably noticed that I added Logon ID along with User name. Using the Logon ID, we can detect from which machine user FSPRO\mike deleted files.

Just set a new filter for event id = 4624 (An account was successfully logged on):

looking for machine - filter by event 4624

And we are getting the machine name and its IP address

workstation name and ip address


Facebooktwitterredditpinterestlinkedinmail

Windows boot performance diagnostics. Part 2

If you read the previous part of this article, you already know what Microsoft-Windows-Diagnostics-Performance log is for, why similar events have different event types and what information is “hidden” in the event details.

Now it’s time to practice. First, we need to decide what we will try to optimize. Let’s display only startup, shutdown and standby/resume events. The event IDs are 100, 200 and 300 respectfully. So let’s filter by event id = 100, 200, 300:
eventfilter-100-200-300

You can optionally switch warnings off in the filter to get error and critical events, but I will leave it checked.

Now we can view statistics of the events. Select Advanced from the main menu, click Analytical Reports. Then in the Analytical Report window click Report and select Event ID stats. I switched to Pivot chart for better view:
boot performance analytical report - standby

As you can see, I have just got a few Windows startup events in this log (and only 1 shutdown event). Most of events here are Standby/Resume events. There are several reasons for this – I switch off/reboot the computer very rarely, most of the time I use hibernate or sleep commands to switch off the computer. My primary drive is a SSD drive so I don’t have problems with prefetch at startup, so My PC commonly starts up in about 10 seconds.  And I don’t have too many autorun programs or services.

However, I really have performance issues with hibernation and resume. So let’s check what the reason of such performance degradation can be. Event 300 contains lots of parameters (similar to event 100 described in the previous post), but they don’t describe the source of the problem. As you may remember, the details of the problems are listed in the events that follow the “basic” events. For standby/resume – they are 3xx. So let’s filter by event id = 301-399 (Note that if you troubleshoot boot up events, it will be 101-110 or 101-199).
eventfilter-301-399

We can build event ID stats diagram again (it is not necessary, but we may find out common reasons of the problems):
degradation-reasons-general

We can see that the typical reasons of the degradations are the device driver issues (302, 351) and application issues (301).

So, let’s concentrate only on these events: set event filter to Event ID = 301, 302, 351
eventfilter-301-302-351

Now we should somehow display the source of the problem. In this article, I showed how to use custom columns. Fortunately for all these events, the sources of the problem have the same sequence numbers:
3 – an application file name or a driver name
5 – friendly name of an application or a driver
11 – full path to an application or a driver.

These numbers you can get from the XML view of these events (double click on event and switch to XML).

I will use friendly name (but you should be aware that some applications may have no friendly name):

Go to View->Custom columns and add a new column from PARAM[5]:
ProblemSource-CustomColumn

Now you can see the problem source as a column in the event list.
performance-diagnostics with custom column displaying faulty app

Let’s create a new pivot chart for this table, event log view to get statistics for “Problem source” column. Go to Advanced->Analytical reports. Then select “CustomColumn1 stats” from the Report menu.
diagnostic performance - reasons of degradation

Now I can see that I should check if a new version of ACPI Driver for NT available (and I should pay attention to Default Hub Driver for USB and several other drivers and applications).

Although I could stop at this point, I will show one more way of detecting the sources of performance issues. When researching events 101+, 201+ and 301+, you can find two parameters under EventData. They are TotalTime and DegradationTime. Totaltime is the time in milliseconds it took for processing (time to initialize a service, start an application, unload application etc). DegradationTime is the time meaning how much longer than usual it took for processing. So, we can exclude some unnecessary events that took not too much time, but are in the list. Let’s display only events that took 300 or more milliseconds. Do not close the pivot chart, just switch back to Event Log Explorer window to set filter. In the article “Advanced filtering. How to filter events by event description” I mentioned about setting XML query filters using XPath syntax. Now we can use it to refine events. Select View->XML query and type

*[EventData[Data[@Name='TotalTime']>'300']]

In my case, the number of displayed events reduced 8 times. Switch back to Analytical Report window and click Reconcile button.
performance diagnostics - refined degradation reasons

And we see a different picture – BlueSoleilCS and ATAPI miniport make contribution to the performance degradation.

I hope that not only you learned about Microsoft-Windows-Diagnostic-Performance events, but also got helpful information about the advanced usage of Event Log Explorer. The article covered several topics that our users often miss: XML view of an event, Analytical reports, custom columns and XML query filter.

Facebooktwitterredditpinterestlinkedinmail