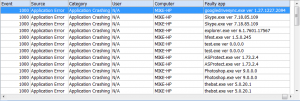
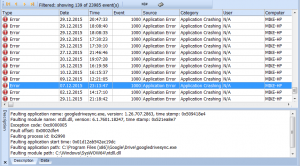
In my article “Exploring who logged on the system“, I described how to add to the event list custom columns that display data from the event description. Probably you might think that adding custom columns works for Security event logs only. Although we initially designed Custom columns feature exactly for Security logs (and referred them by name, e.g. Subject\Account name), we made it possible to use it with any logs.
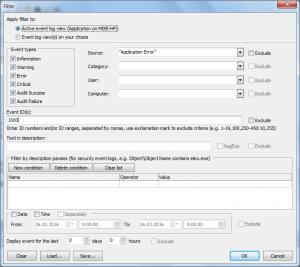
Let’s take a typical system engineer or administrator task to discover faulty applications on the system. We will search for application error events. Such events are stored in Application event log, event source is “Application Error” and they are commonly registered with Event ID=1000. Therefore, we need to open Application log, and refine its events:
We can see that the description of event 1000 is not so well-structured as descriptions in Security log:

so it is impossible to refer description parameters by name.
However, we can still refer these parameters by number as {PARAM[x]}.
Look at the event description. The application name and its version is in the very beginning:
Faulting application name: googledrivesync.exe, version: 1.27.1227.2094, time stamp: 0x509418e4
Most likely, we will refer app name as PARAM[1] and its version as PARAM[2], but let’s make sure.
Double click on an event to get Event Properties and switch to XML tab.
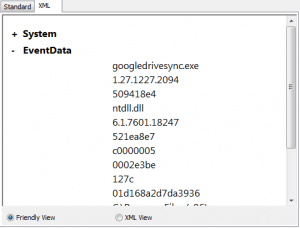
Yes, we can see that googledrivesync.exe 1.27.1227.2094 are the first and the second parameters respectively.
In this example, I will display app name and version number in one column as googledrivesync.exe ver 1.27.1227.2094, but you can try 2 columns (for name and version #) or get rid of version number at all.
Open Custom columns dialog (View->Custom columns).
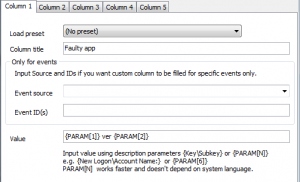
Title the column as Faulty app
Leave Event source and Event ID(s) blank (your log is filtered).
Set Value to {PARAM[1]} ver {PARAM[2]}
Press OK and enjoy the result!
