Author Archives: Michael Karsyan

7 Best Windows Event Viewer Alternatives for Log Analysis in 2026

Windows Event Viewer works for a quick look at one local log. Once Windows events become part of your regular work, its limits cost time: multi-log investigations are awkward, remote systems are cumbersome to manage, and reusable analysis setups are limited. A dedicated tool should let you move from an alert or symptom to a repeatable investigation without rebuilding the same view every time.

Our recommendation is Event Log Explorer. It provides the most complete desktop workflow in this comparison for live local and remote logs, saved EVTX and legacy EVT files, multi-log analysis, reusable Tasks, direct reporting, and optional forensic recovery or continuous collection. The other products below remain useful, but most solve a narrower problem or belong to a different product category.

Disclosure. We develop Event Log Explorer. The comparison uses product documentation current in September 2026 and states the cases where a free viewer, DFIR parser, hunting tool, or server platform addresses a different requirement.

What a Better Event Viewer Should Provide

For occasional troubleshooting, the built-in viewer is adequate. For sustained work, the useful dividing line is whether the tool improves the complete investigation rather than only opening an EVTX file.

  • Open live local and remote logs as well as saved files without changing tools.
  • Combine related channels and computers into one chronological investigation.
  • Preserve queries, columns, sorting, source lists, and display choices for later reuse.
  • Filter early enough to avoid loading or transferring irrelevant events.
  • Export findings in formats colleagues can use without rebuilding the analysis.
  • Extend the same workflow into recovery or monitoring when the job requires it.


Quick Comparison by Workflow

These tools serve different jobs. Start with the work you need to do; the detailed sections below explain each tool’s capabilities and limits.

Tool Main job How you work License
Event Log Explorer Investigate Windows events across local, remote, and saved logs; reuse the setup Desktop app; optional command-line exports Free noncommercial home use; paid editions
Microsoft EventLogExpert Explore live local logs and EVTX files in a free GUI Desktop app MIT open source
FullEventLogView Inspect local, remote, or saved logs quickly; export results Portable app; command-line export Freeware
LogViewPlus Analyze Windows events alongside text, Syslog, and other log formats Desktop app Commercial
EvtxECmd and Timeline Explorer Turn offline EVTX collections into timelines for forensic review Command-line parser plus desktop viewer Free tools
Hayabusa Find suspicious activity with detection rules across Windows events Command-line scan and timeline export AGPLv3 open source
ManageEngine EventLog Analyzer Collect, retain, and monitor logs centrally across many systems Server with web console Free up to five sources; paid plans

1. Event Log Explorer Best Overall for Windows Event Log Analysis

Designed for  administrators, support engineers, security analysts, and forensic investigators who repeatedly work with Windows events

License: free for personal noncommercial home use; commercial editions start at $209 for Standard Edition

Event Log Explorer is our recommended Windows Event Viewer alternative for recurring investigations. It combines live local and remote access, EVTX and legacy EVT support, reusable multi-source Tasks, direct Excel and PDF export, and optional damaged-log, disk-image, or continuous-collection workflows.

That combination matters because Windows event analysis rarely stays inside one file. A service failure can involve the System log, an application channel, and events from another computer. A security case may begin with live logs and end with offline evidence. Event Log Explorer keeps those steps in one interface and lets the analyst save the setup for the next occurrence.
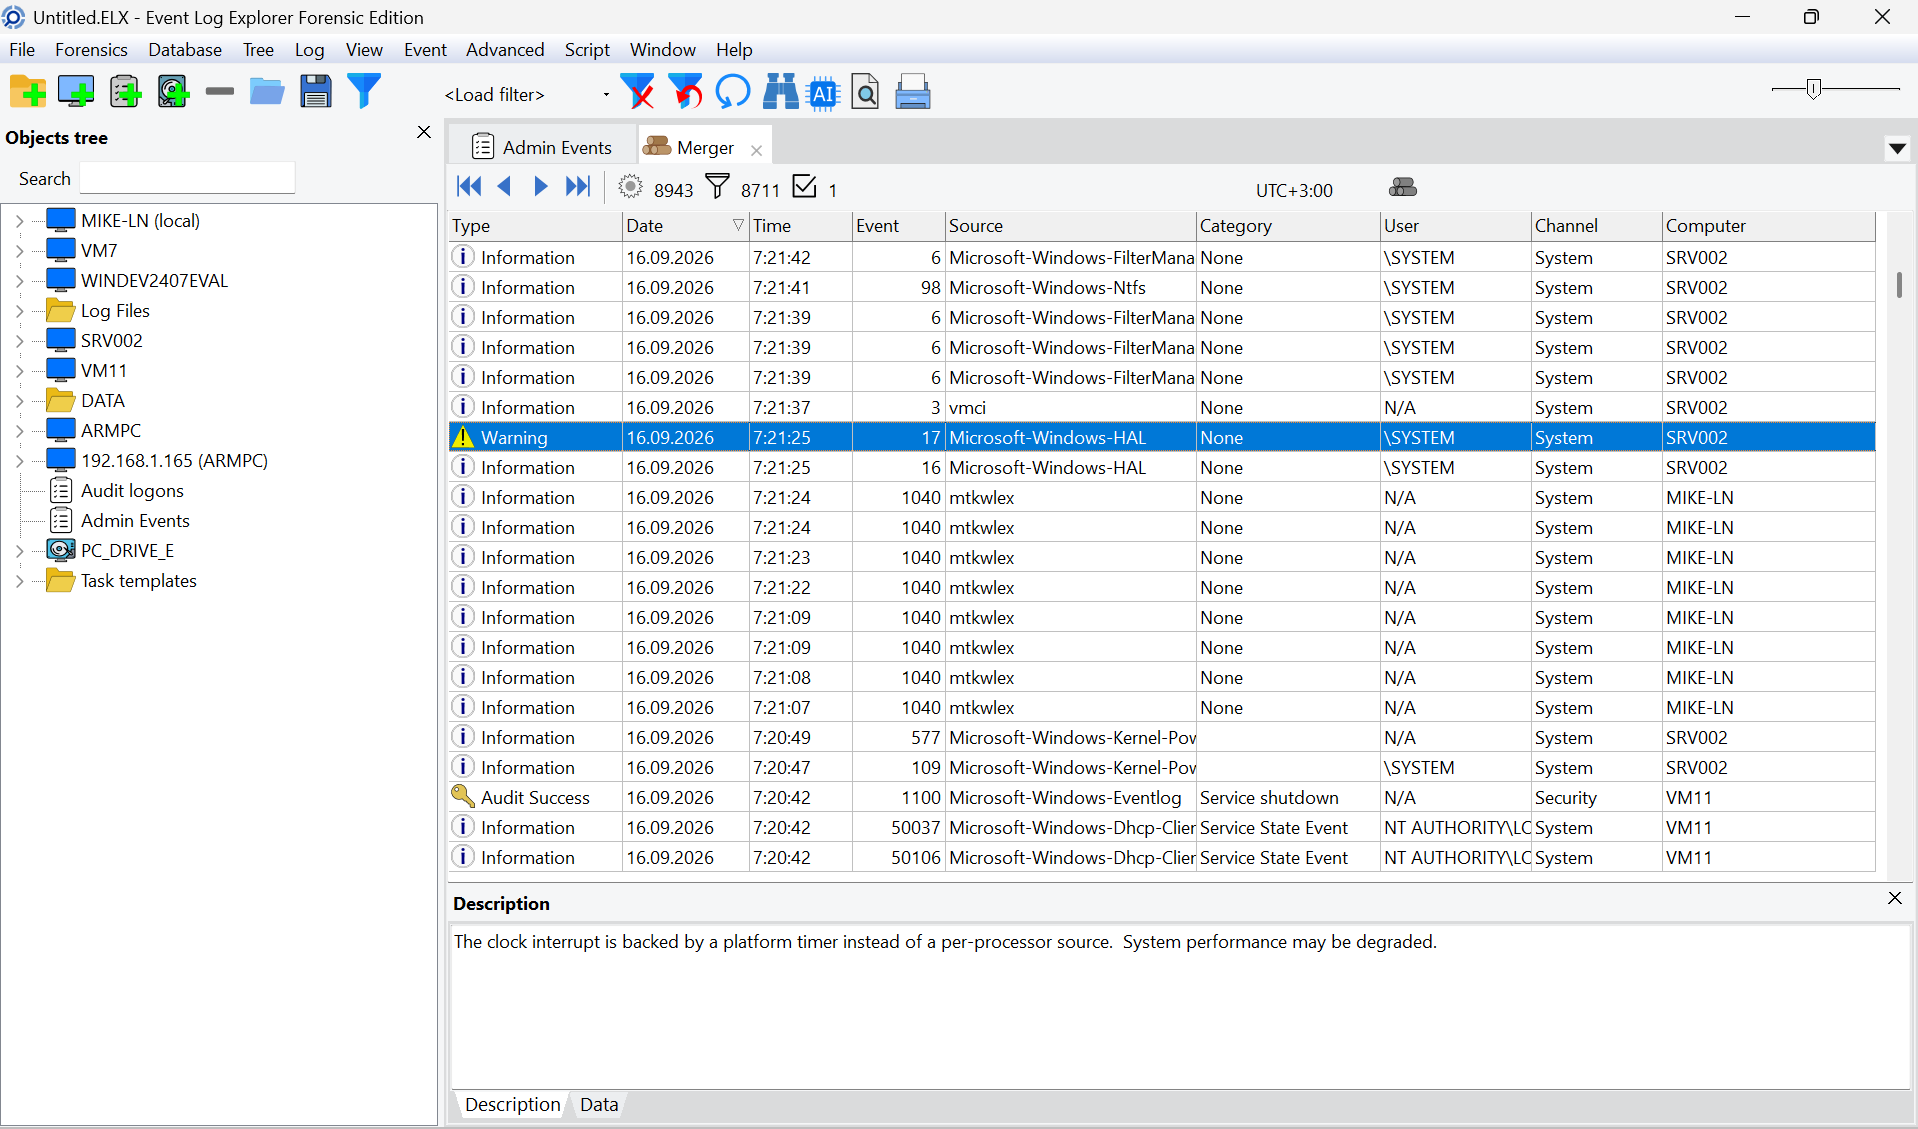
Events from different computers and channels merged into one chronological view in Event Log Explorer.

Events from different computers and channels merged into one chronological view in Event Log Explorer.

Remote Work Is Part of the Core Product

Remote access is more than a Connect to Computer command. Event Log Explorer maintains a computer tree with groups and credentials, can import computers from Active Directory, and includes Network Scanner and Connectivity Testing tools. That makes it practical for support teams that work with remote event logs every day.

Source-side XML queries can reduce the events transferred from a remote computer before they cross the network. Load-time filters narrow the initial dataset, while after-load filters support fast interactive refinement. These three filtering stages serve different purposes and avoid treating every investigation as a full-log download followed by a local search.

Tasks Preserve the Investigation

An Event Log Explorer Task is more than a saved filter. It can retain the selected computers and log sources, XML query, columns, sorting, and display options. Predefined templates make a working method reusable; the Audit RDP logons example builds on targeted filtering by event content. Workspaces keep several related views together. Custom columns, bookmarks, color coding, charts, reports, and pivot charts help an analyst move from individual events to patterns without exporting every intermediate step.

A reusable Task created from the Audit RDP logons template for EVTX files from two computers

A reusable Task created from the Audit RDP logons template for EVTX files from two computers.

When results do need to leave the tool, Event Log Explorer exports directly to Excel, HTML, text, and PDF. Command-line options support scheduled or repeatable exports, and Enterprise and Forensic editions add PascalScript for more specialized automation.

The Product Family Extends the Same Workflow

  • Standard Edition. Live local and remote logs, EVTX and EVT files, merged views, Tasks, templates, workspaces, charts, reports, command-line automation, and Copilot assistance.
  • Forensic Edition. Direct access to damaged EVTX and EVT files, imaged-computer and raw-image analysis, deep scan, searches for removed events, snapshots, and other recovery-oriented checks. Pricing starts at $529.
  • Enterprise Edition. Elodea can collect events continuously into Microsoft SQL Server and trigger alerts by email, executable, or HTTP request. Enterprise Edition starts at $529 for one user and five monitored computers.
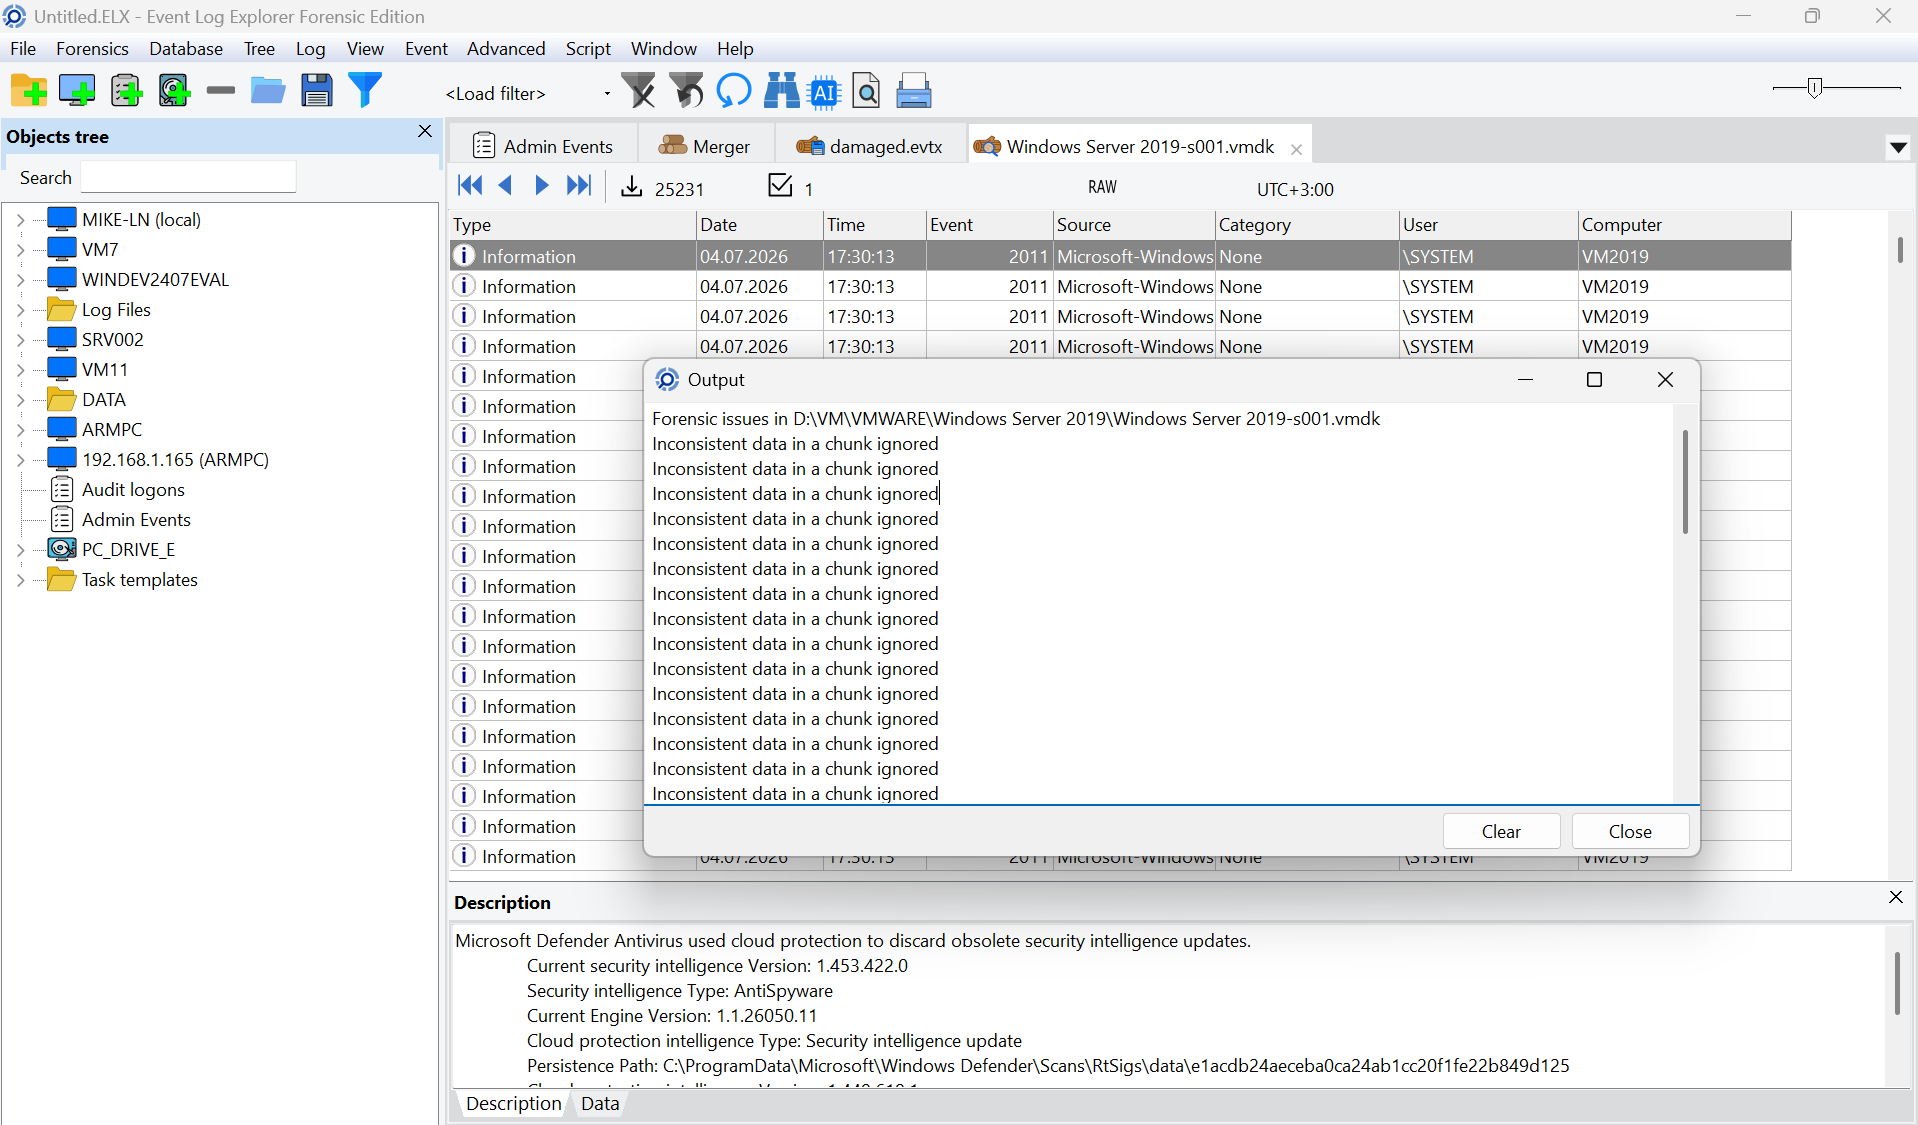
Deep Scan results from a damaged VMware VMDK image, including recovered events and skipped inconsistent data

Deep Scan results from a damaged VMware VMDK image, including recovered events and skipped inconsistent data.

The built-in Copilot feature is deliberately analyst-controlled. Event Log Explorer prepares a prompt in an embedded browser, and the user chooses what to submit. Descriptive details remain visible in the application and are not automatically copied into the prompt. This makes AI assistance useful without turning the viewer into an autonomous data-upload pipeline.

Pricing and edition details are available on the product site.

Try Event Log Explorer with your own logs. Download the current release, or compare Standard, Forensic, and Enterprise editions to choose the workflow that fits your environment.

When Another Category May Fit

Choose a smaller free utility if you only open an EVTX file a few times a year. Choose a general log viewer when Windows events are a small part of a mixed text, Syslog, and database workflow. Use a CLI hunting tool when the first step is running Sigma rules across a large evidence collection. Use a server platform when the requirement is organization-wide retention, compliance, and correlation across many source types. The right starting point depends on the workflow.

2. Microsoft EventLogExpert

Use case: users who want a free modern Windows Event Log interface for local live logs and saved EVTX collections

License: MIT open source

Microsoft EventLogExpert is the main free GUI comparison point in this list. It opens EVTX files or folders, combines them with live local logs, filters structured data, saves filters, and exports CSV or JSON. It also offers a timeline histogram, in-view search, statistics, filter lenses, correlation details, and built-in triage scenarios.

The documented live workflow is local and requires Windows 11, Windows Server 2022, or Windows Server 2025. EventLogExpert does not provide legacy EVT support, remote-computer management, damaged-log recovery, direct disk-image scanning, continuous collection, or central storage. Its offline-image provider database resolves descriptions; it does not recover event logs from the image itself.

3. FullEventLogView

Use case: quick local, remote, or EVTX viewing with no installation

License: freeware

FullEventLogView is a compact NirSoft utility that starts quickly and covers the common viewing jobs. It reads local and remote Windows event logs, opens EVTX files, filters events, displays descriptions and raw XML, and exports from the GUI or command line. Supported output includes text, CSV, tab-delimited, HTML, XML, JSON, and raw event XML.

Its command-line options, automatic refresh, and tray notifications make it useful for simple scripts or lightweight watching. The product remains a viewer, however. It does not provide the multi-step Task model, investigation workspaces, charts, reports, forensic recovery, or integrated collection found in Event Log Explorer. It also targets the modern Windows Event Log API rather than legacy EVT workflows.

4. LogViewPlus

Use case: teams that need one desktop application for Windows events and many non-Windows log formats

License: commercial; Personal $45 and Corporate $95 per user at the time of writing

LogViewPlus approaches the problem as a general log-analysis product. It can connect to local and remote Windows Event Logs, parse EVTX files, merge logs, build dashboards and reports, query parsed entries with LVP SQL, and attach rules or notifications to filters. It also handles application text logs, Syslog, databases, ETW, UDP, and other sources.

That breadth is useful when an incident crosses several unrelated formats. The tradeoff is depth in Windows-specific workflows. Teams that mainly work with Windows events gain a more focused remote-management model, legacy EVT support, reusable Tasks, and optional forensic recovery or continuous collection from Event Log Explorer. LogViewPlus also uses AI narrowly as a prompt helper for constructing LVP SQL rather than as event-focused assistance.

5. EvtxECmd and Timeline Explorer

Use case: forensic analysts who convert EVTX collections into normalized timeline datasets

License: EvtxECmd is MIT open source; Timeline Explorer is free to use but closed source

EvtxECmd is a command-line parser for batch processing EVTX evidence into CSV, XML, or JSON. Custom Maps normalize event-specific fields into consistent columns, and volume shadow copy options fit established DFIR collection pipelines. Timeline Explorer then provides a GUI for sorting, filtering, grouping, and reviewing CSV or Excel output.

This pipeline is effective when evidence is already being normalized with other forensic artifacts. It is less direct for an analyst who needs to move among live remote logs, event descriptions, merged source views, bookmarks, and repeatedly refined filters. Event Log Explorer works on the original live or saved events and preserves the interactive investigation; EvtxECmd produces datasets for a downstream timeline workflow.

6. Hayabusa

Use case: security teams that run detection rules across large EVTX collections

License: GNU AGPLv3; detection rules use the separate Detection Rule License 1.1

Hayabusa is a Rust-based hunting and forensic timeline tool. It processes local live logs or offline EVTX collections, produces CSV, JSON, or JSONL timelines, and supports Sigma rules including Sigma 2 correlation. Enterprise-scale collection can be integrated through Velociraptor.

Hayabusa is a detection engine rather than a desktop Event Viewer replacement. It makes sense when the first question is whether a large collection matches known suspicious behavior. It is not designed for comfortable remote browsing, rich event-description work, saved interactive investigations, or damaged-log recovery. Teams can use Hayabusa for first-pass hunting and Event Log Explorer for the detailed investigation that follows.

7. ManageEngine EventLog Analyzer

Use case: organizations that need server-based retention, compliance reporting, correlation, and alerting across many systems

License: Free Edition for up to five log sources; Professional starts at $795 per year for 10 sources

ManageEngine EventLog Analyzer collects, archives, searches, correlates, and reports on logs from Windows and hundreds of other source types. It belongs in this list because buyers often search for Event Viewer alternatives when their real requirement is continuous centralized monitoring. It is a server platform, not a direct replacement for opening and investigating a few EVTX files.

The platform’s advantages are central storage, compliance reports, real-time security auditing, and broad infrastructure coverage. Zia Insights can generate incident summaries, timelines, possible MITRE ATT&CK mappings, and mitigation guidance using Azure OpenAI, but it is available only in Premium and Distributed editions. Buyers should not infer that the $795 Professional entry price includes it.

For a Windows-only environment that needs collection from a handful or a few dozen computers, Event Log Explorer Enterprise can be simpler and keeps collected events in the same analysis interface. ManageEngine becomes relevant when heterogeneous sources, long-term governance, and organization-wide server workflows are the primary requirement.

Which Tool Should You Choose

Start with the work you need to repeat. Product category is more important than the number of checkmarks on a feature page.

Your main requirement Recommended starting point
Repeated investigation of local, remote, saved, or legacy Windows logs Event Log Explorer
Recovery of damaged logs or analysis of disk images Event Log Explorer Forensic Edition
Continuous collection in a smaller Windows environment Event Log Explorer Enterprise Edition
A free desktop app for live local logs and EVTX files Microsoft EventLogExpert
A portable viewer with scripted CSV, JSON, or XML export FullEventLogView
Windows events alongside text, Syslog, and application logs LogViewPlus
Batch parsing of EVTX into forensic timelines EvtxECmd and Timeline Explorer
Detection-rule scanning across large EVTX collections Hayabusa
Central retention, monitoring, and compliance reporting across many sources ManageEngine EventLog Analyzer

Frequently Asked Questions

What Is the Best Alternative to Windows Event Viewer?

Event Log Explorer is the best overall alternative for professionals who regularly investigate Windows Event Logs. It combines live local and remote sources, saved EVTX and legacy EVT files, multi-log views, reusable Tasks, reporting, automation, and optional forensic or collection features in one desktop product.

Is There a Free Alternative to Event Viewer?

Yes. Microsoft EventLogExpert provides a free modern GUI for current Windows versions, while FullEventLogView is a lighter portable viewer with extensive command-line export. Event Log Explorer is also free for personal noncommercial use at home.

What Is the Best Tool to Open EVTX Files?

For a quick look, Event Viewer, EventLogExpert, or FullEventLogView can open EVTX files. Choose Event Log Explorer when the file is part of a larger investigation that needs several logs, reusable queries, event descriptions, reporting, remote context, or forensic recovery.

Can I View Multiple Windows Event Logs Together?

Yes. Event Log Explorer merges events from several live logs or saved files into one chronological view and preserves the source set inside a Task. EventLogExpert and LogViewPlus can also combine sources, but Event Log Explorer adds the reusable Windows-specific investigation model around that view.

What Should I Use for Forensic EVTX Analysis?

Event Log Explorer Forensic Edition is the most complete choice here for interactive work with damaged logs, disk images, deep scans, snapshots, and searches for removed events. EvtxECmd is useful when the goal is batch parsing into normalized datasets, while Hayabusa focuses on automated detection across large collections.

Do I Need a SIEM to Monitor Windows Event Logs?

Not always. Event Log Explorer Enterprise can collect Windows events continuously into SQL Server, send alerts, and keep analysis in the desktop application. A large heterogeneous environment with formal compliance and SOC workflows is a better match for a server platform such as ManageEngine EventLog Analyzer.

What About Microsoft Log Parser?

Log Parser 2.2 remains useful for legacy scripts and specialized SQL-like queries across several data formats. It has not evolved with the modern Windows Event Log ecosystem, so it should not be the starting point for a new Event Viewer replacement in 2026.

Conclusion

A free viewer is enough when Windows events are an occasional task. When they are part of your job, Event Log Explorer provides the most complete dedicated desktop workflow in this comparison. It manages live local and remote systems, combines modern and legacy logs, preserves repeatable investigations, exports usable reports, and extends into recovery or continuous collection without forcing the analyst into a different product.

The remaining tools address narrower workflows: a no-cost local GUI, a portable viewer, mixed-format logs, batch DFIR parsing, Sigma-based hunting, or organization-wide log management. For sustained Windows Event Log analysis, start with Event Log Explorer.

Ready to replace Event Viewer for regular investigations? Download Event Log Explorer or review pricing and licensing for the edition that matches your workflow.

Facebooktwitterredditpinterestlinkedinmail

Solving Problems When Opening Remote Windows Event Logs

Several years ago, I published an article describing how to configure Windows for remote access to event logs. Since then, we have received many support requests related to connectivity and authentication problems. As a result, we added a built-in Connectivity Test to Event Log Explorer to simplify troubleshooting and help identify the most common configuration issues.

Although this article focuses on Event Log Explorer, the troubleshooting steps apply equally to Windows Event Viewer and any other software that accesses Windows event logs remotely.

The most common error reported by our users is “The RPC server is unavailable”. Windows Event Viewer may display “Access is denied” instead. While these messages are often accurate, they do not provide enough information to identify the actual cause of the problem.

To make troubleshooting easier, Event Log Explorer includes a Connectivity Test that reproduces the initial stages of establishing a remote Event Log connection and reports any problems it detects.

To run the test, first add the remote computer to the tree. Even if automatic discovery does not work, you can add the computer manually by entering its name or IP address. Then right-click the computer and select Connectivity Test. The program performs a series of network and RPC checks and displays the result of each step.

For a complete description of all diagnostic results, see the Event Log Explorer documentation:

https://eventlogxp.com/help/remote_computer_connectivity_test.html

Below are the most common problems and their causes.

Connectivity Problems

RPC port available

This check verifies that TCP port 135 (the RPC Endpoint Mapper) is accessible on the remote computer.

If this check fails, it usually means that TCP port 135 is blocked by a firewall or that there is no network connectivity between the two computers.

Event Log dynamic port resolved

If this step fails, the problem is usually not network-related. Instead, the Event Log service on the remote computer is probably not running or is unable to register its RPC endpoint.

Event Log dynamic port available

Passing the first RPC test does not guarantee that the Event Log service can be reached. After connecting to the RPC Endpoint Mapper on port 135, Windows obtains the dynamically assigned RPC port used by the Event Log service and connects to that port.

If this check fails, TCP port 135 is reachable, but the Event Log service cannot be reached through its dynamically assigned RPC port. In most cases, this means that the Remote Event Log Management (RPC) firewall rule is not enabled on the remote computer or is enabled for the wrong network profile (Private, Public, or Domain).

If you connect by computer name rather than IP address, also make sure that the name resolves to the correct computer.

Authentication Problems

Even after all connectivity problems have been resolved, opening the remote event log may still fail with “Access is denied”. In this case, the problem is usually related to authentication or permissions rather than network connectivity.

Workgroup networks

In workgroup environments, the most common cause is that Windows authenticates you as a Guest user instead of using your local credentials.

To fix this, make sure that the Network access: Sharing and security model for local accounts security policy is set to Classic – local users authenticate as themselves on the remote computer.

If possible, create a local user account on the remote computer with the same user name and password that you use on your own computer. If this is not practical, Event Log Explorer can prompt you for remote credentials or you can store them in its built-in Credential Manager.

Event Log permissions

Even if authentication succeeds, your account may not have permission to read remote event logs.

For most logs, adding your account to the Event Log Readers group is sufficient.

This may seem surprising, but users who are members of the local Administrators group can sometimes have more difficulty accessing remote event logs than users who are members of Event Log Readers because of User Account Control (UAC) remote restrictions.

UAC remote restrictions

By default, not all event logs are accessible to members of the Event Log Readers group. Some logs under Microsoft\Windows require administrative privileges, including AppXDeploymentServer/Restricted, ASN1/Operational, CAPI2/Operational, Crypto-NCrypt, Diagnostics-Performance, and several others.

Although these logs are not frequently used, you may occasionally need to examine them.

In this case, administrative access is required. However, local administrator accounts may still be restricted by UAC when connecting remotely.

To disable UAC remote restrictions, open Registry Editor (regedit.exe) on the remote computer and navigate to:

HKEY_LOCAL_MACHINE\SOFTWARE\Microsoft\Windows\CurrentVersion\Policies\System

Create (or modify) the LocalAccountTokenFilterPolicy DWORD value and set it to 1.

In Active Directory domain environments, this configuration is usually unnecessary because domain accounts that are members of the local Administrators group are typically not affected by these remote UAC restrictions.

Kerberos authentication and VPN clients

Another possible cause of “Access is denied” is a Kerberos authentication issue.

Some VPN clients modify the local DNS configuration or change the preferred network interface, which may prevent Windows from obtaining or using the correct Kerberos service ticket for the remote computer. Although the remote computer remains reachable over the local network, authentication may still fail.

As a workaround, try adding the remote computer by its IP address instead of its host name. Kerberos authentication requires a Service Principal Name (SPN) associated with the host name, so connecting by IP address usually causes Windows to fall back to NTLM authentication instead.

This workaround may not work in environments where NTLM authentication is restricted or disabled by Group Policy. In that case, temporarily disconnect the VPN client, establish the remote connection, and then reconnect the VPN if necessary.

Time synchronization

In Active Directory environments, Kerberos authentication also depends on accurate time synchronization.

If the clocks on the client computer, the remote computer, and the domain controller differ by more than the allowed tolerance (typically five minutes), Kerberos authentication may fail, resulting in an “Access is denied” error.

Conclusion

The issues described above are the most common causes of remote event log access failures, although they do not cover every possible scenario.

Unlike Windows Event Viewer, which usually reports only a generic error message, recent versions of Event Log Explorer include a built-in Connectivity Test that helps identify the actual cause of connection problems and significantly simplifies troubleshooting.

If you regularly work with Windows event logs, give the latest version of Event Log Explorer a try. Its built-in Connectivity Test helps diagnose remote access problems much faster than standard Windows Event Viewer, making troubleshooting easier for both administrators and support engineers.


Facebooktwitterredditpinterestlinkedinmail

Understanding Windows Events Made Easier: Event Log Explorer Meets Microsoft Copilot

When reviewing Windows event logs, administrators are often faced with an overwhelming number of events. While some events include clear and helpful descriptions, many are cryptic, poorly documented, or difficult to interpret—especially when troubleshooting complex issues.

Earlier versions of Event Log Explorer addressed this challenge by allowing users to look up additional information in public knowledge bases such as EventID or the Microsoft Events Knowledge Base. Many users relied on these integrations to better understand events during log analysis. Unfortunately, these knowledge bases are no longer available, and as a result, we recently removed their integration from Event Log Explorer.

A Modern Alternative: AI-Assisted Event Analysis

The good news is that modern large language models (LLMs) are now capable of providing meaningful explanations and troubleshooting guidance for many Windows events. We researched and evaluated several Artificial Intelligence (AI) chatbots to find the most reliable option for Windows event analysis and found that Microsoft Copilot consistently delivers the most accurate and relevant results in this area.

Microsoft Copilot is powered by advanced OpenAI GPT–class models and enhanced by Microsoft’s own adaptations. These include training on Microsoft-specific resources and optional Bing grounding, which allows Copilot to enrich its responses with up-to-date information from Bing search results. This combination makes Copilot particularly effective at explaining Windows Event IDs, audit events, and system messages.

Event Log Explorer + Microsoft Copilot

Starting with the latest version, Event Log Explorer is integrated with Microsoft Copilot, enabling AI-assisted analysis directly from your event logs.

Using this feature is simple:

  1. Select an event in Event Log Explorer.
  2. Click the AI button on the toolbar.
  3. A new window opens with an internal web browser that launches a Copilot chat.
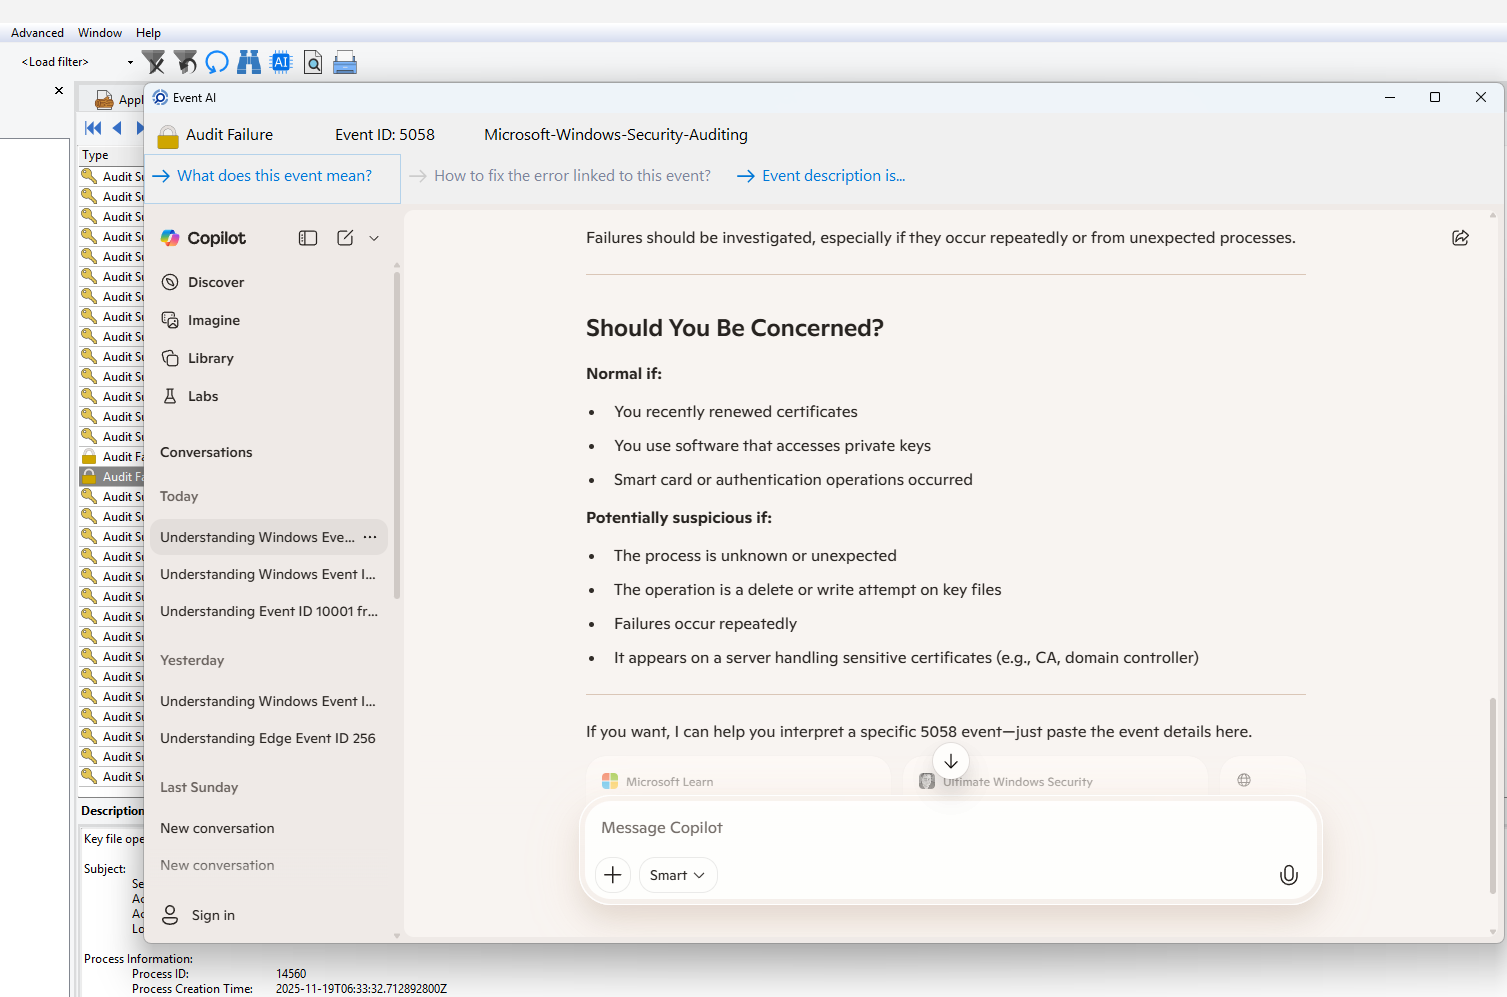
  4. Event Log Explorer automatically prepares a prompt, for example:
    “What does Audit Success Event ID 6417 from source Microsoft-Windows-Security-Auditing mean?”

The embedded browser also provides several predefined prompt buttons for common analysis tasks—just click a button to send the prompt to Copilot. You can also write your own custom prompts at any time.

If a prompt includes event description details, they are displayed but not automatically sent. This gives you the opportunity to review and remove any sensitive information before submitting the query, helping you stay in control of your data.

Why This Matters

With Copilot integration, Event Log Explorer once again offers a powerful way to understand complex events—this time using AI instead of static, outdated knowledge bases. You can quickly:

  • Understand what an event means
  • Identify likely causes
  • Discover possible troubleshooting steps
  • Reduce time spent searching documentation manually

Conclusion

Windows event logs remain one of the most valuable—and most challenging—sources of diagnostic information. By integrating Microsoft Copilot, Event Log Explorer brings modern AI capabilities directly into the event analysis workflow. This new approach replaces discontinued knowledge bases with a smarter, more flexible, and continuously improving solution that helps administrators, security specialists, and digital forensic professionals work faster and more effectively.

👉 Download the latest version of Event Log Explorer today and experience AI-powered event log analysis with Microsoft Copilot.
Spend less time guessing what events mean—and more time solving real problems.


Facebooktwitterredditpinterestlinkedinmail

Improving Event Log Filtering in PowerShell

Recently, one of our customers asked us to help port their PowerShell script to our script engine (built on FastScript/Pascal Script). While helping them, we paid close attention to how they filtered events in PowerShell—and noticed a common performance pitfall.

Their original script filtered the System log by event type using a pipeline:

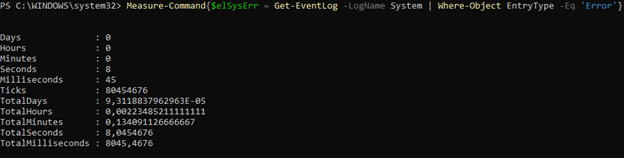
$elSysErr = Get-EventLog -LogName System | Where-Object EntryType -Eq 'Error'

Although the PowerShell pipeline is a powerful feature, using it here is unnecessary and inefficient. This command first loads all events from the System log into memory and only then filters them by type. A more efficient approach is to filter during retrieval:

$elSysErr = Get-EventLog -LogName System -EntryType 'Error'

This runs faster—but there’s a bigger issue.
You shouldn’t use Get-EventLog at all:

  1. Its filtering parameters are limited (no reliable way to filter by Event ID).
  2. It works only with classic/legacy logs.
  3. It relies on deprecated Windows APIs.

Microsoft now recommends using Get-WinEvent, which is documented here:
https://learn.microsoft.com/en-us/powershell/module/microsoft.powershell.diagnostics/get-winevent

Rewriting the Command with Get-WinEvent

At first glance, you might simply replace Get-EventLog with Get-WinEvent:

$elSysErr = Get-WinEvent System | Where-Object LevelDisplayName -eq 'Error'

Or slightly better:

$elSysErr = Get-WinEvent System | Where-Object Level -eq 2

But this still requires reading the entire log first—so you gain no performance benefits.

The real power of Get-WinEvent is that it allows event filtering before reading the log. You can filter in two ways:

  • Using a hashtable
  • Using an XML (XPath) query

Using a Hashtable (the simplest approach)

$elSysErr = Get-WinEvent -FilterHashTable @{LogName='System'; Level=2}

Using an XPath query

$elSysErr = Get-WinEvent -LogName 'System' -FilterXPath '*[System[(Level=2)]]'

Performance Comparison

I ran all variations against my local System log (≈50,000 events), using Measure-Command.

Pipeline filtering (Get-EventLog + Where-Object)

Measure-Command { Get-EventLog -LogName System | Where-Object EntryType -Eq 'Error' }

≈ 8 seconds

Filter parameter (Get-EventLog -EntryType)

Measure-Command { Get-EventLog -LogName System -EntryType 'Error' }

≈ 6 seconds (about 25% faster)

Pipeline filtering with Get-WinEvent

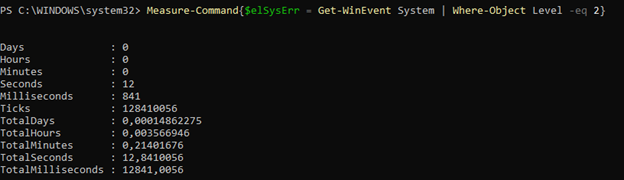
Measure-Command { Get-WinEvent System | Where-Object Level -eq 2 }

≈ 13 seconds (even slower!)

FilterHashTable (the fastest)

Measure-Command { Get-WinEvent -FilterHashTable @{LogName='System'; Level=2} }

≈ 566 ms

XPath filter

Measure-Command { Get-WinEvent -LogName 'System' -FilterXPath '*[System[(Level=2)]]' }

≈ 600 ms

Conclusion:

For performance, always use Get-WinEvent with -FilterHashTable, -FilterXML, or -FilterXPath.

Handling the “No events found” error

One important detail rarely mentioned in online resources:
If no events match the filter, Get-WinEvent throws a non-terminating error.

This is not a big issue in interactive sessions, but in scripts it produces noisy output. To avoid this, simply ignore the error:

$elSysErr = Get-WinEvent -FilterHashTable @{LogName='System'; Level=2} -ErrorAction SilentlyContinue
if ($elSysErr -eq $null) {
    Write-Output "no events match this filter"
} else {
    # work with the result set
}

How This Looks in Event Log Explorer Script Engine

Here’s how we port the same query into our scripting engine:

theApp.OpenLogQuery('', 'System', '*[System[(Level = 2)]]', True);

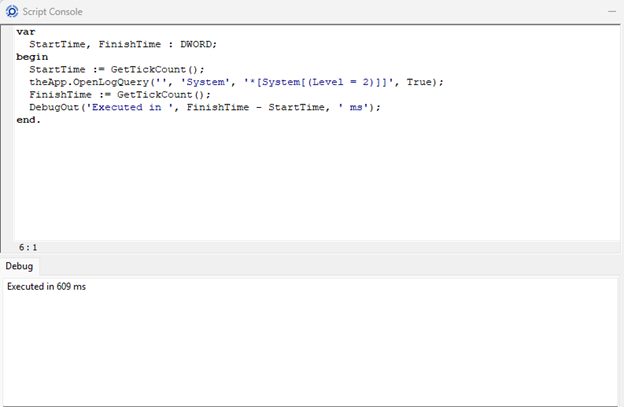
To measure performance:

var
  StartTime, FinishTime: DWORD;
begin
  StartTime := GetTickCount();
  theApp.OpenLogQuery('', 'System', '*[System[(Level = 2)]]', True);
  FinishTime := GetTickCount();
  DebugOut('Executed in ', FinishTime - StartTime, ' ms');
end.

Result: ≈ 609 ms
Not bad—especially considering it not only retrieves the events, but also displays them.

Closing Thoughts

That’s all for now. As the developers of Event Log Explorer, we strongly recommend using our software for tasks involving event log analysis. However, we fully recognize that PowerShell offers an exceptionally powerful scripting environment for managing Windows systems. When you choose to work with PowerShell, it’s important to do so efficiently—and using the right event filtering techniques can dramatically improve performance.
Facebooktwitterredditpinterestlinkedinmail

Windows Event Log API Bug Ruins Most Event Log Software

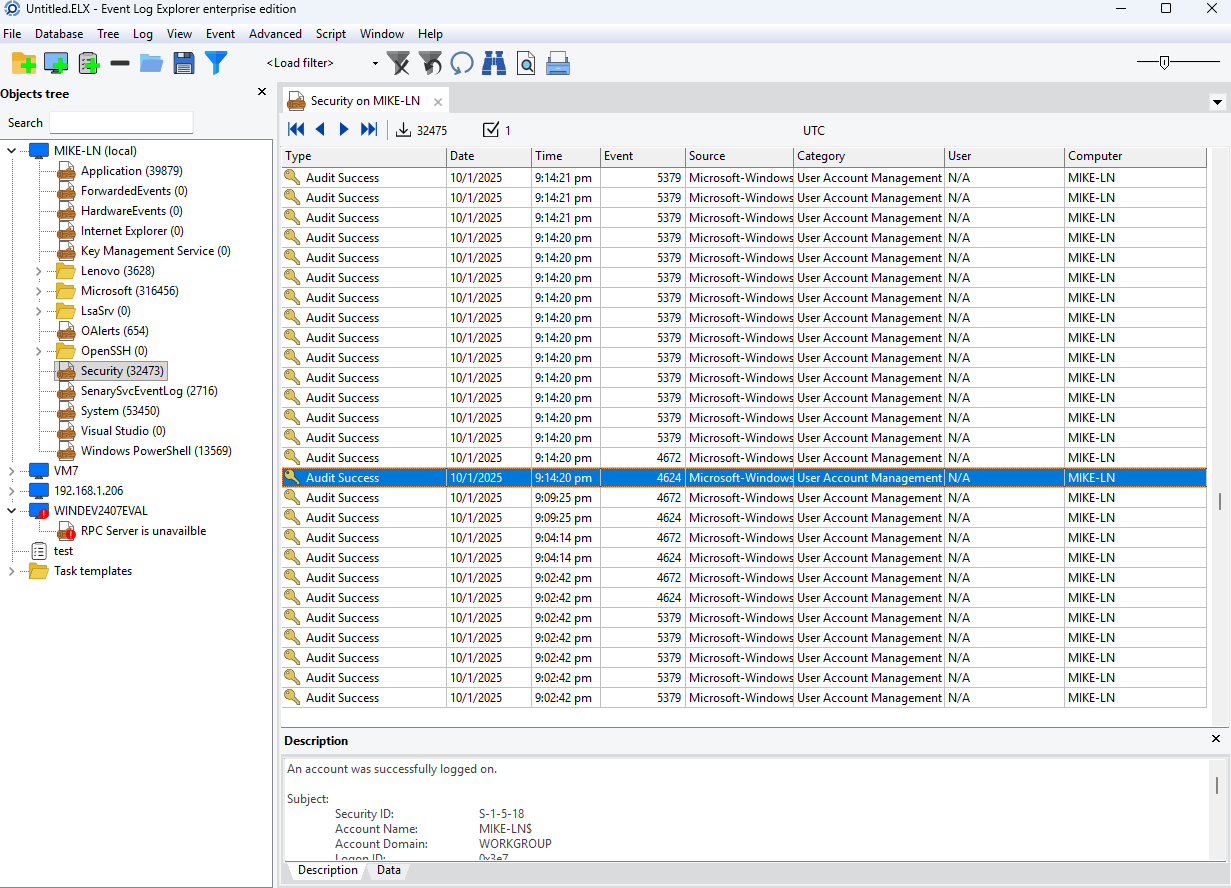
Recently, our support team received a bug report that Event Log Explorer was displaying incorrect task categories for Security event logs.
The user reported that on their Windows 11 24H2 and 25H2 systems, Event Log Explorer showed the same category for all security events.

At first, we couldn’t believe it — so we tested it ourselves.

Sure enough, we reproduced the issue immediately.
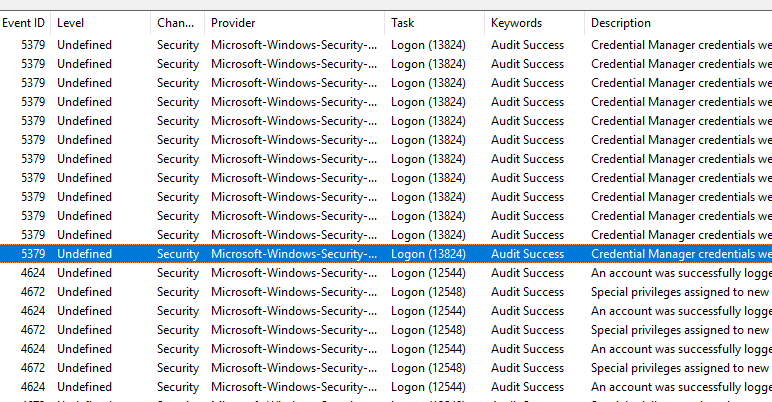
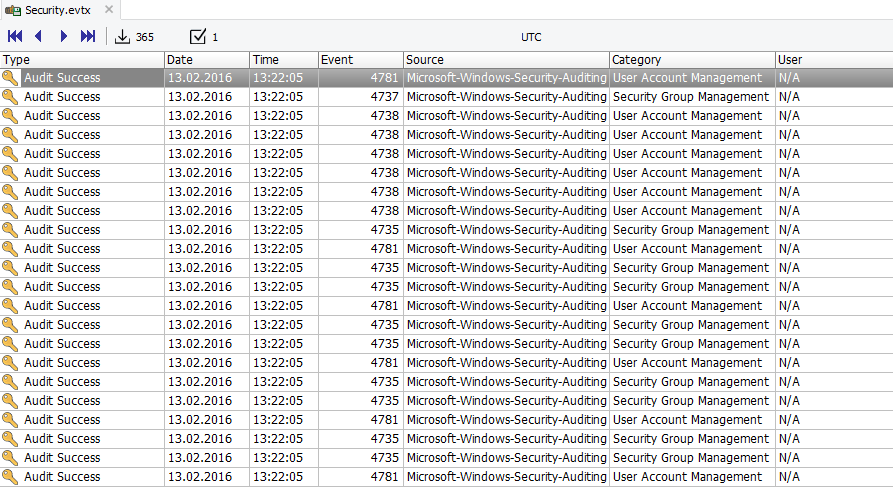
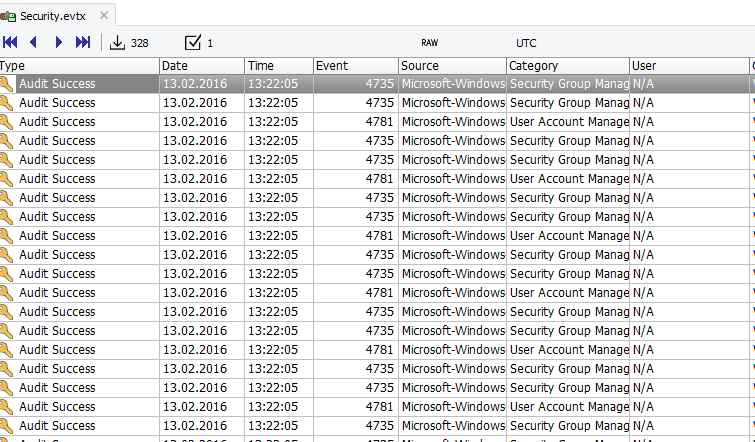
Same task categories in the log

And yet, Windows Event Viewer displayed everything correctly.

🔍 Checking Older Windows Versions

Suspecting a Windows regression rather than a bug in our code, we tested on Windows 11 22H2 — and everything worked perfectly.

Even more interesting:

  • Running Event Log Explorer on 22H2 to read logs from 24H2 → ✅ task names display correctly
  • Running Event Log Explorer on 24H2 to read logs from 22H2 → ❌ task names display incorrectly

That ruled out our parsing logic and clearly pointed to an API-level problem in Windows 11 24H2 / 25H2.

🧪Testing Other Tools

To verify further, we tested with other event-log viewers.

NirSoft’s FullEventLogView

It showed the same issue — identical task names for every Security event.

FullEventView has the same issue

Interestingly, Event Log Explorer and FullEventLogView even displayed different wrong names.

Microsoft’s Own Utilities

Let’s check wevtutil:

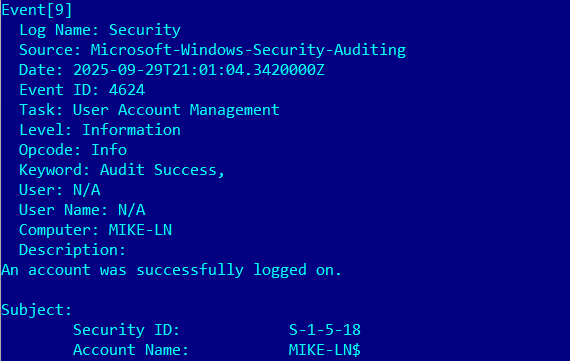
wevtutil.exe qe Security /c:30 /f:text > security.txt

wevtutil displays incorrectly

When reviewing security.txt, we found that every event — even logon events — had the same category: User Account Management

PowerShell

Then we tried PowerShell:

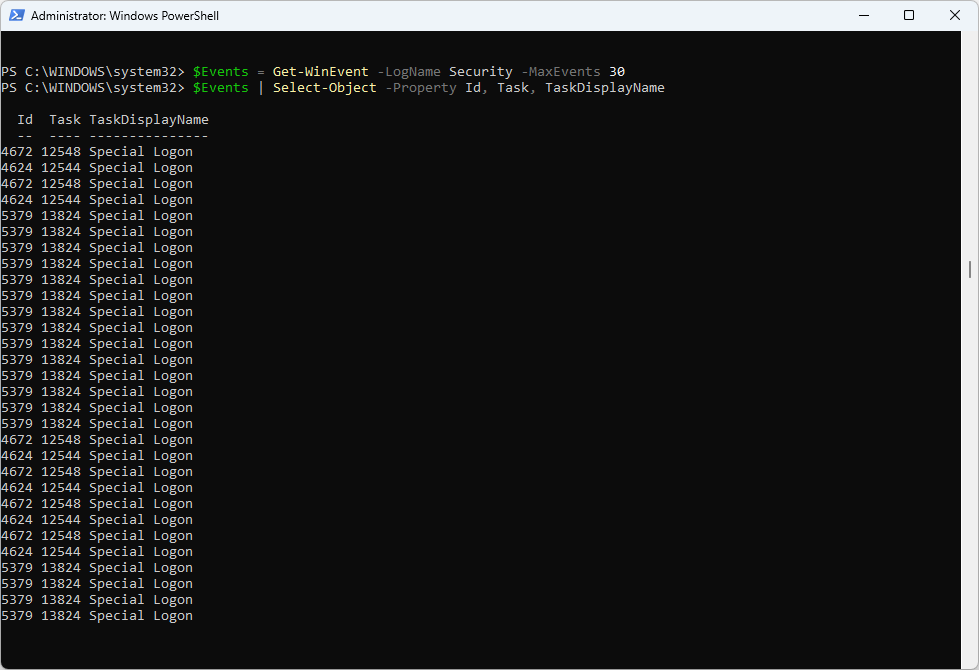
Run PowerShell as Admin, type commands:

$Events = Get-WinEvent -LogName Security -MaxEvents 30

$Events | Select-Object -Property Id, Task, TaskDisplayName

Powershell also displays incorrect task name

Again — the same task name appears for different task IDs.

✅ Conclusion: this is a Windows Event Log API bug, not an Event Log Explorer issue.

But… why does the built-in Event Viewer still work?

⚙️ How the Windows Event Log API Works

Windows does not store the task category as text.
To save disk space, it stores a numeric ID, and software must resolve it to text using a message file.

In pre-Vista days, developers had to manually locate the category message file and extract text strings.
That process was slow, so caching was essential.

Modern Windows provides a cleaner API:

  1. Open event source metadata:
    hMetadata = EvtOpenPublisherMetadata(…)
  2. Retrieve task name:
    EvtFormatMessage(hMetadata, hEvent, …, EvtFormatMessageTask, …)
  3. Close the metadata handle:
    EvtClose(hMetadata)

Developers often cache metadata handles to avoid reopening them repeatedly.
However, that optimization exposes a serious bug in recent Windows builds.

🐞The Root Cause

If you close and reopen the metadata handle, task names are resolved correctly. So I believe that Microsoft uses this ways in Event Viewer.
But if you reuse the same handle, EvtFormatMessage seems to cache results internally —
and that cache depends only on the metadata handle, not the task ID.

In other words:

Microsoft’s internal caching forgets to consider the task ID when formatting messages.

Interestingly, the semi-documented function EvtRpcMessageRender behaves correctly.

🧰 Our Fix in Event Log Explorer 5.7.2

As soon as we identified the cause, we released Event Log Explorer 5.7.2, which includes robust workarounds for this Windows API bug.

Affected programs:

  • Event Log Explorer (all editions)
  • Event Log Explorer Elodea Collector
  • Event Log Database Exporter (Eldbx)
  • Event Log Explorer Exporter (Logexport)

Depending on the module, we:

  • Switched to using EvtRpcMessageRender, or
  • Continued using the standard Windows Log API but explicitly closed and reopened metadata handles.

Internally, event tasks are now cached efficiently, preserving high performance.

✅ Recommendations

  • Update immediately to the latest version of Event Log Explorer.
  • If you use other event log utilities that haven’t implemented a workaround yet, switch to Event Log Explorer to ensure accurate task category display.
  • PowerShell users: avoid relying on task category names until Microsoft releases an official fix.

🧩 Final Thoughts

This issue highlights how a subtle regression in a low-level Windows API can silently break multiple third-party tools.
While Microsoft’s Event Viewer remains unaffected, nearly all other log viewers — including ours — were impacted.

We’ve done our part to provide reliable workarounds.
Now we’re waiting for Microsoft to officially fix the API.

Facebooktwitterredditpinterestlinkedinmail

Event Log Explorer Goes 64-bit: Unlocking the Power of Large-Scale Event Analysis

We’re excited to announce the release of a new beta version of Event Log Explorer Forensic Edition (5.6), featuring a game-changing update: native 64-bit support!

This upgrade significantly enhances Event Log Explorer’s capabilities, especially for users working with large event log datasets. Here’s why:

Breaking the Memory Barrier

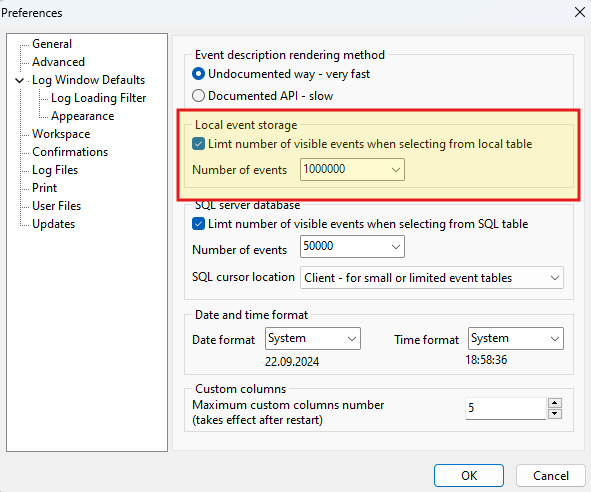
While Event Log Explorer efficiently loads event logs into a temporary local database, it still requires memory to display each event. Previous 32-bit versions were limited by the Windows architecture, allowing a maximum of 3GB of addressable memory on 64-bit systems (or 2GB on 32-bit). This restricted the number of events you could display to around 4-5 million.

Expanding Your Horizons

To address this limitation, we introduced a feature to display only a specific number of events, providing a manageable experience even with large datasets.

However, some users desired to see all events without restrictions.

With the new 64-bit version, these limitations are a thing of the past. 64-bit Event Log Explorer can access up to 8TB of virtual address space, allowing you to analyze vast event logs without encountering memory constraints.

Experience the Difference

We encourage you to try out this new beta version and let us know your feedback.

Download the new beta today and experience the power of 64-bit Event Log Explorer for yourself!


Facebooktwitterredditpinterestlinkedinmail

Extra power of custom columns

Approximately 10 years ago, we introduced custom columns in Event Log Explorer. This feature allows users to extract event details from the event description or event XML. Custom columns have significantly enhanced our customers’ ability to get more information from events, and we have continuously improved it across different versions. Previously, Event Log Explorer treated custom column values as text, which sometimes was insufficient for in-depth analysis. For example, in my article about tracking printer usage, it was impossible to sort events by the number of pages.

Since version 5.5, Event Log Explorer allows users to specify the type of custom values.

Let’s take the same printer usage problem and solve it using this new power.

  1. Make sure that logging of Microsoft-Windows-PrintService/Operational log is enabled on your print server and open it.
  2. Set filter to Event ID = 307
  3. Optionally hide unnecessary columns like Type, Event Id, Source, Category, User
  4. Set custom columns as follows:
    Column 1:
    Column title: Printer user
    Value: {DATA[3]}
    Treat value as : Text
    Column 2:
    Column title: Printer
    Value: {DATA[5]}
    Treat value as: Text
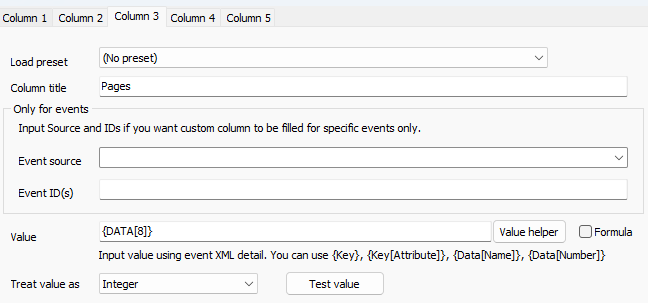
    Column 3:
    Column title: Pages
    Value: {DATA[8]}
    Treat value as: Integer

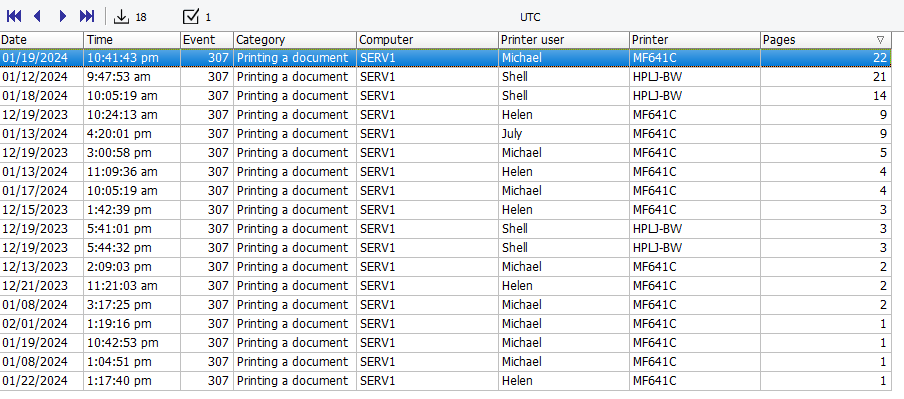
As seen, you only need to set “Treat value as” to Integer for the last custom column. This will display events like the previous versions displayed, but now the Pages column is shown as an integer column.

This means that you can now sort by this column from lowest to highest value (or vice versa), not just alphabetically. You can also filter by this value (e.g., greater than or less than).

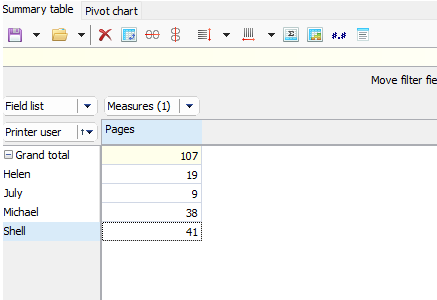
Furthermore, you can now create a summary table and calculate the total number of pages by every user. To do so, you will need to generate a new analytical report.

Select Advanced->Analytical reports from the main menu.

Then select Field List and move “Printer user” to the left area.

Select Field List again and move Pages to the central area.

Next, move Measures (1) into the top area.

This will create a summary table that looks like this:

Note that Event Log Explorer automatically calculates the sum of pages for each user because Sum is the default aggregative function for integer fields. However, you can change it to any other aggregative function if needed. For instance, if you want to get the average number of pages every user prints at once, expand Measures (1), right-click on Pages, select Properties, and in the Measure Editor dialog, change Sum to Average, then click OK.

As you can see, custom columns now offer enhanced capabilities for analyzing Windows event logs.

Get the latest version of Event Log Explorer to leverage the full potential of custom columns right away!

Facebooktwitterredditpinterestlinkedinmail

Scripting in Event Log Explorer

Starting from version 5.1 Event Log Explorer comes with scripting support (scripting is implemented in the forensic and enterprise editions). Scrips help you automate many routine tasks and improve your performance.

Scripting lets you can open logs, set filters, scan event views, remove specific events from a log view, export events and many more.

The scripting language we use in Event Log Explorer is PascalScript (FastScript by FastReports). It is similar to Pascal language with some limitation. You can download our scripting reference at https://eventlogxp.com/download/elex_scripting.pdf

Some sample scripts are available in folder “C:\ProgramData\Event Log Explorer\Scripts\Samples\”.

In this article we will write a script that merges security event log files located in one folder and displays only Audit Failure events.

Let’s start. First you need to start Event Log Explorer (Forensic or Enterprise edition) 5.2 or higher.

From the main menu select Script -> Script Console. Now you can type your script.

Consider that your log files are stored in C:\LogList folder and security log file names start with ‘Sec’, e.g. ‘security-08-2022.evtx’.

We have procedure GetFileList which returns list of files matching the specified mask. It copies the list into TStringList.

To run this procedure, we have to create TStringList object first:

var
  FileList : TStringList;
begin
  //create object FileList of TStringList class
  FileList := TStringList.Create;

  // fill FileList with file names from C:\LogList 
  // which start with 'sec' and have evtx file extension
  GetFileList('C:\LogList\sec*.evtx', FileList);

  // display the content of FileList in the debug console
  DebugOut(FileList.Text);

  // always free objects you created
  FileList.Free;
end.

Since you have a list of logs to merge, you can use function CreateLogFileMerger to open your files in a merger. This function is a method of TSApp class. When you start Event Log Explorer, it automatically creates an TheApp object which is a single instance of TSApp class (you cannot create TSApp instances manually).

You can use TheApp properties and methods to manage Event Log Explorer application.

CreateLogFileMerger creates an event log view contain events from all event log files in the list and returns a new TSLogView object associated with the log view.
The first parameter of this function is FileNames of TStringList class. It is the same list we got by GetFileList function, but CreateLogFileMerger requires full path of file names. So, we need to add ‘C:\LogList\’ before every name in the list.

Modifying the script as follows:

var
  FileList : TStringList;
  i : Integer;
begin
  //create object FileList of TStringList class
  FileList := TStringList.Create;

  // fill FileList with file names from C:\LogList 
  // which start with 'sec' and have evtx file extension
  GetFileList('C:\LogList\sec*.evtx', FileList);

  // Converting every name to full path name
  for i := 0 to FileList.Count-1 do
    FileList[i] := 'C:\LogList\'+FileList[i];

  // display the content of FileList in the debug console
  DebugOut(FileList.Text);

  // always free objects you created
  FileList.Free;
end.

It’s time to create the merger. Add Merger declaration:

var
  Merger : TSLogView;

and Merger creation before FileList.Free:

Merger := TheApp.CreateLogFileMerger(FileList, True);

The second parameter of CreateLogFileMerger  defines if the script waits until all the logs are loaded or not. Since we want to filter the merger, we should wait.

To filter the log view, we can access the EventFilter property of the TSLogView and call EventFilterApply method to apply the filter:

// Clear current filter first

Merger.EventFilter.Clear;

// Set filter to display Audit Failure events only

Merger.EventFilter.EVT_AUDIT_FAILURE := True;

// Apply the filter

Merger.EventFilterApply;

The final script:

var
  Merger : TSLogView;
  FileList : TStringList;
  i : Integer;
begin
  FileList := TStringList.Create;
  GetFileList('C:\LogList\sec*.evtx', FileList);
  for i := 0 to FileList.Count-1 do
    FileList[i] := 'C:\LogList\'+FileList[i];
  Merger := TheApp.CreateLogFileMerger(FileList, True);
  FileList.Free;
  Merger.EventFilter.Clear;
  Merger.EventFilter.EVT_AUDIT_FAILURE := True;
  Merger.EventFilterApply;
end.

That’s all. As you can see, Event Log Explorer provides powerful, but not hard to use scripting mechanism to automate your tasks. Download Event Log Explorer (Forensic or Enterprise Edition) and write your own event log scripts!

Facebooktwitterredditpinterestlinkedinmail

Event Log Explorer Forensic Edition – Snapshots

Taking snapshots is one of the great new features in the Forensic Edition. Whenever you need to save a set of events for future analysis, you can take a snapshot and then load it without access to the original log or log file. Snapshots are like event log backups, but there are some differences.

While backups work with the entire event log (or in some cases with event logs, filtered by an XML query), you can take a snapshot from a log view or even from separate events. Backing up from remote computers could be painful because it’s linked with extra administration tasks like sharing resources and granting permissions. Unlike backups, you can take snapshots much easy. It’s just like event export, but you can load the snapshot and work with it as you work with an event log file. Also, you can optionally save the current time zone and custom fields into the snapshot. Note that the snapshots contain the rendered descriptions and task category name. You don’t need to have specific components (dll or exe files) on your computer to display the text correctly.

Some situations when snapshots may help you:

  • You connected to a remote computer, opened an event log and want to save it locally.
  • You opened a large log file, filtered events and you want to continue working with these events only. It is always easier to work with smaller files — filtering and sorting operations are faster.
  • You opened an event log and have concerns about some events. You can bookmark these events and save them as a snapshot. Then you can send this snapshot to another person for research.
  • You merged different logs from different computers in one log view and want to save it as one file for further exploring.

It is very easy to take and load snapshots with Event Log Explorer.

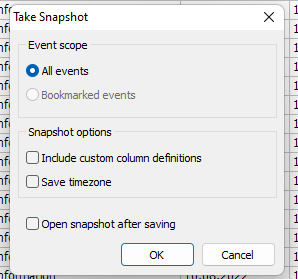
To take snapshot from the active log view, select Forensics->Take snapshot from the main menu and click OK button.

To load snapshot, select Forensics->Load snapshot from the main menu.
That’s it

Download Event Log Explorer Forensic Edition and try to save your logs as snapshots.


Facebooktwitterredditpinterestlinkedinmail

Event Log Explorer Forensic Edition – working with damaged logs or disks

In this article, I will show how to work with damaged event log files. Event Log Explorer forensic edition can extract events from damaged files.

Let’s take a log file (e.g. a security log file) and open it with Event Log Explorer using File-> Open Log File.

Event Log Explorer opens this file as it always does.

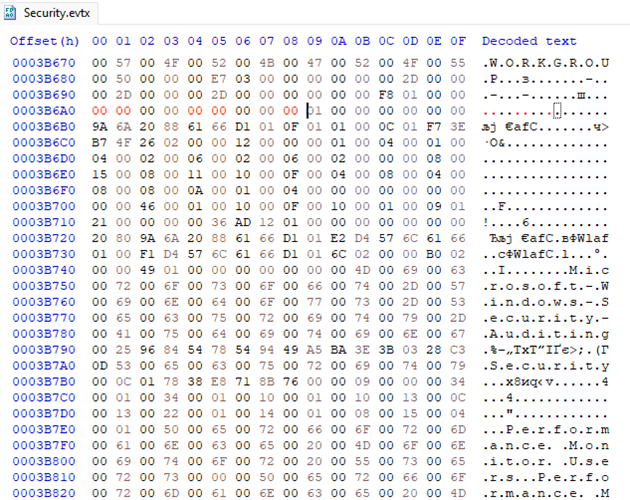
Now we will intentionally corrupt this log. I will modify several bytes (commonly, it’s enough to change only 1 bit) with any hex editor. It is not necessary that someone may damage an event log – it’s not easy, but such issues may occur because of technical defects like hardware failures, driver errors, etc.

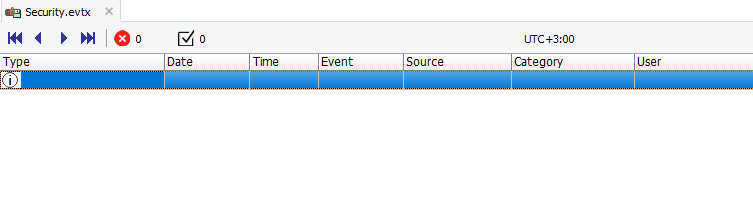
Now if you try to open this event log file, Event Log Explorer will display zero events:

You can see a red sign near the navigation buttons. If you hover your mouse over this sign, you will see a message “The event log file is corrupted”.

A similar problem occurs if you open this log in Windows Event Viewer:

Event Viewer cannot open the event log or custom view. Verify Event Log service is running or query is too long. The event log file is corrupted (1500).


However, it’s still possible to read events from this log file!

Select Forensics->Forensic Open File and change File Access Method to Direct Access Method.

This feature will open your log file!

Note that in my case, it displays fewer events than it displayed for the original event log, but this is better than 0 events anyway.

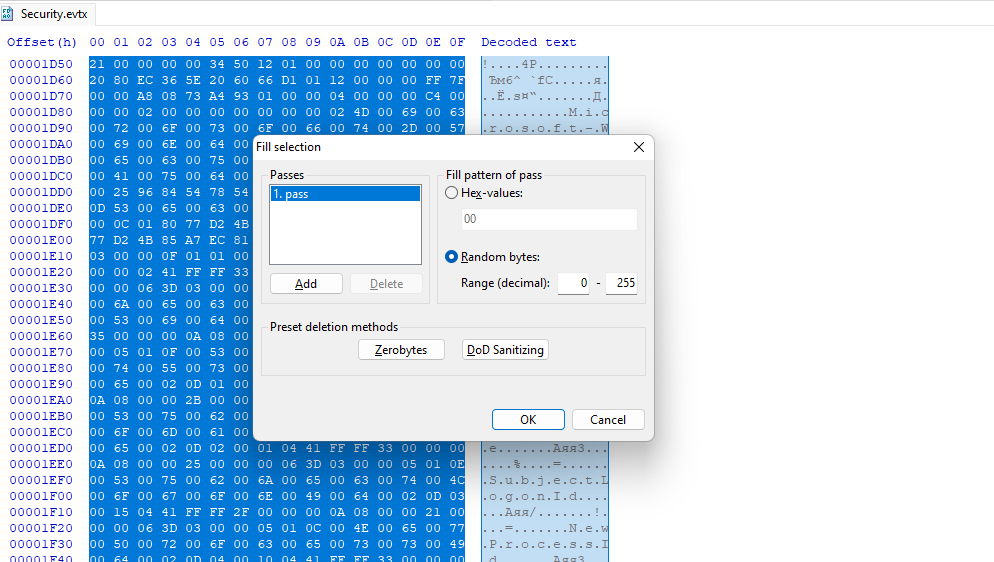
Let’s make more changes to the log and fill the first 8K with random bytes.

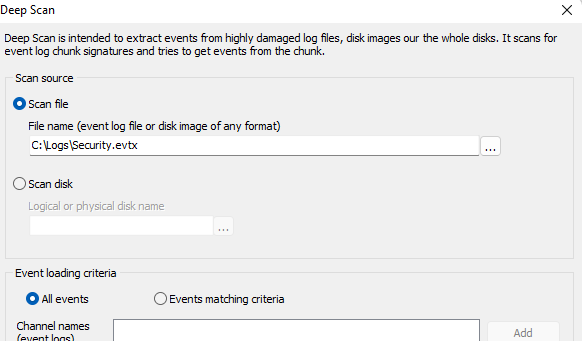
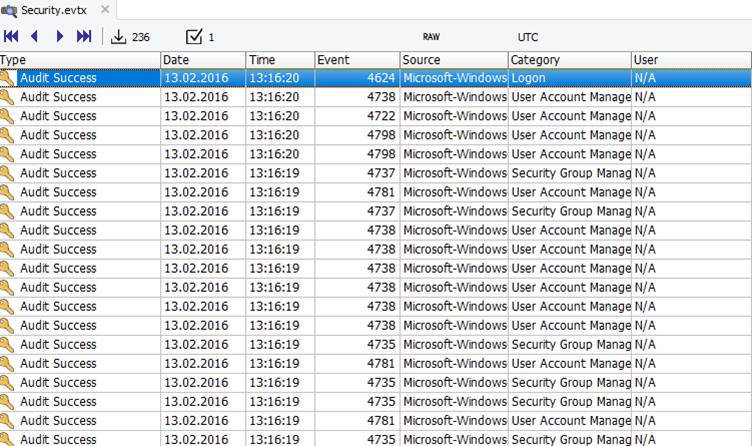
If you try to open it using Direct method as before, Event Log Explorer will fail to open it. However, you can use Deep Scan option. Open Forensic->Deep Scan, select your file and press OK.

Event Log Explorer will scan your files for events.

You can use deep scan not only for event log files. You can scan disk images including virtual disks or even physical or logical disks.

Deep scan may help you to find more events even if you have undamaged event log files. E.g. if a log was cleared, you can still find cleared events on the disk if they were not overwritten.

Download Event Log Explorer Forensic Edition and try Deep scan and Direct file access options with your files!

Facebooktwitterredditpinterestlinkedinmail