At the time, the US companies spend a total of $120 billion on printed forms annually, and each employee uses about 10,000 sheets of paper according to CompTIA. That’s why printer usage monitoring is very important to cut costs for printer supplies and their utilization. Another reason to know who and how uses corporate printers is to manage your resources and plan upgrades or downgrades of certain printers or print servers.
If you google for “printer usage” or similar phrases, you will find dozens of special software to monitor printers. As a rule, these programs are installed on print servers and most of them are not cheap.
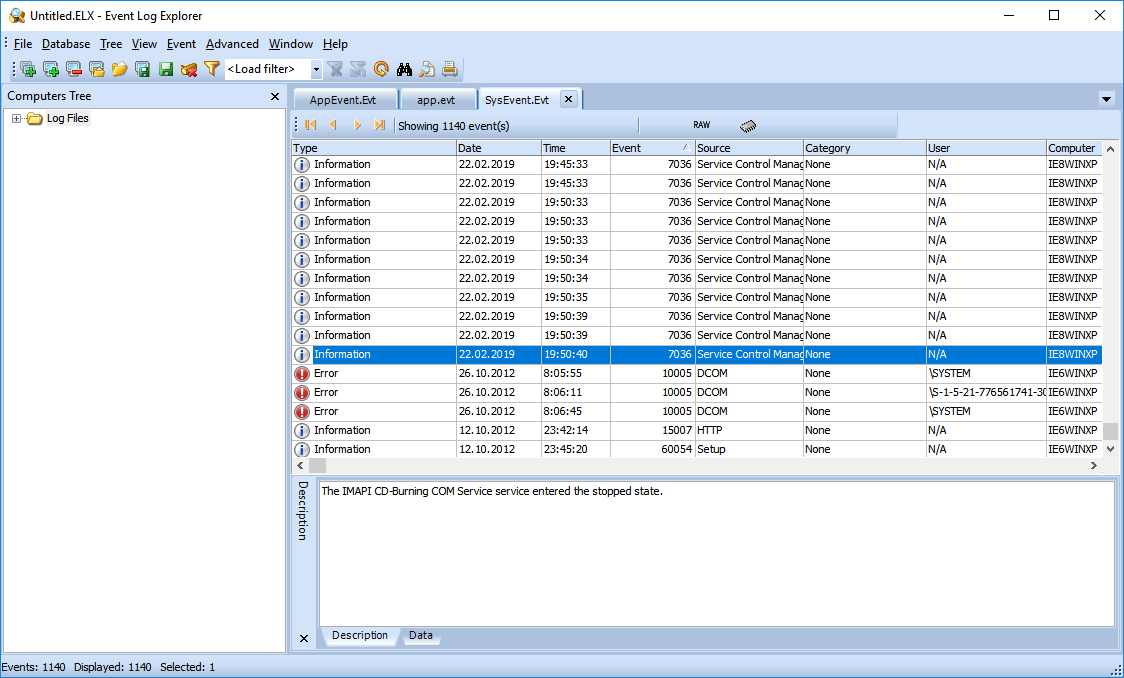
However, you can track printer usage without any third-party software by analyzing Windows events of Print Spooler. And use of Event Log Explorer makes this process much better.
To start monitoring you should enable logging to log \Microsoft-Windows-PrintService/Operational:
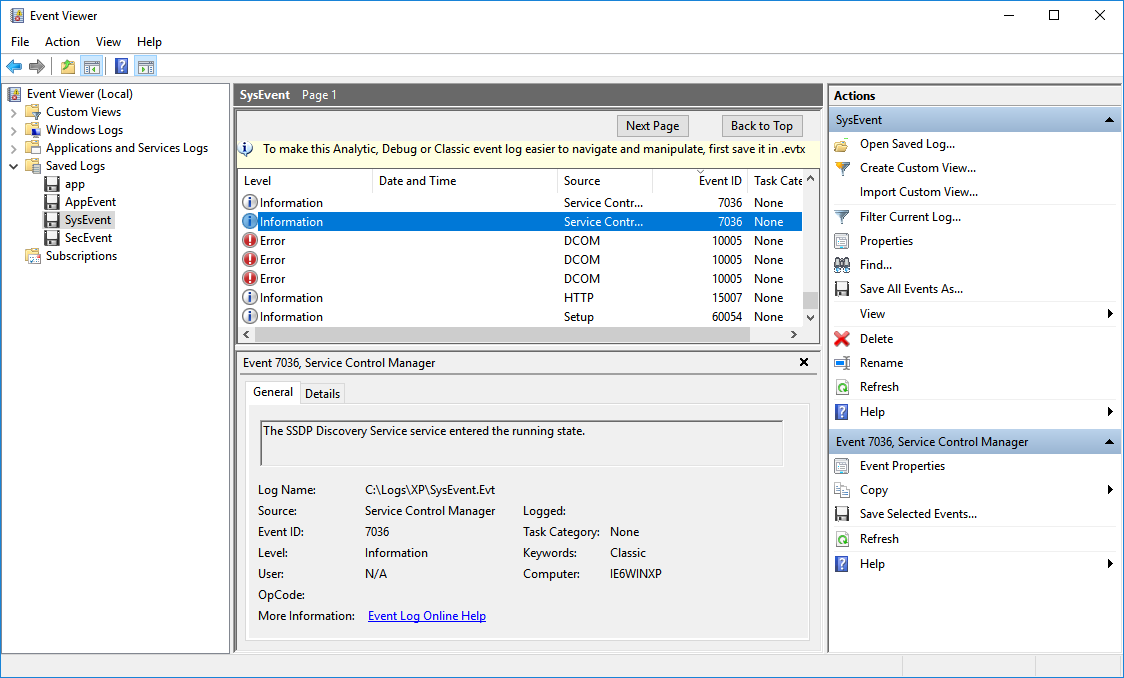
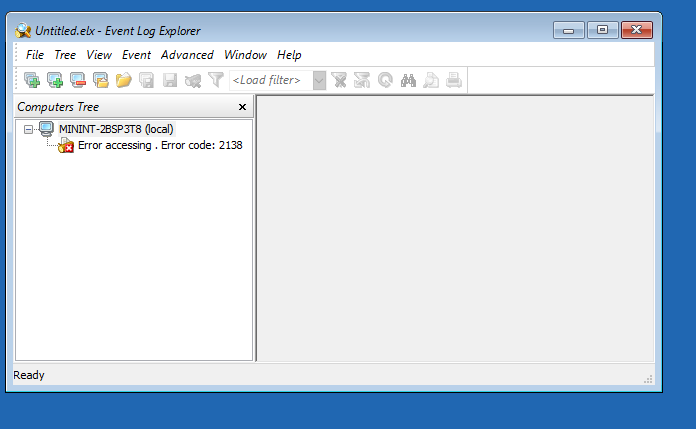
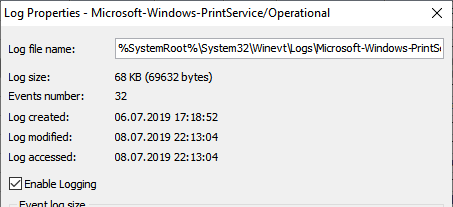
Start Event Log Explorer (or Event Viewer), connect to your print server from Event Log Explorer or Windows Event Viewer, browse to event log Microsoft-Windows\\Microsoft-Windows-PrintService/Operational, click right mouse button on it and select Properties.
In Log Properties dialog tick Enable Logging.
Or just run wevutil utility in the elevated prompt as follows:
wevtutil.exe
sl Microsoft-Windows-PrintService/Operational /e:true  /r:<Server_name>
I assume that you have a print server (Server_name) in your network (running Windows 2008 or higher) and your users print documents via this server. If you have printers connected directly to the user computers, you should consider these computes as print servers and enable logging to PrintService/Operational on them.
If you want to monitor what exactly your user print, I recommend enabling “Allow job name in event logs” policy to log documents name. If you run Windows 2012 or Windows 8, you may need to apply a Windows update as described here.
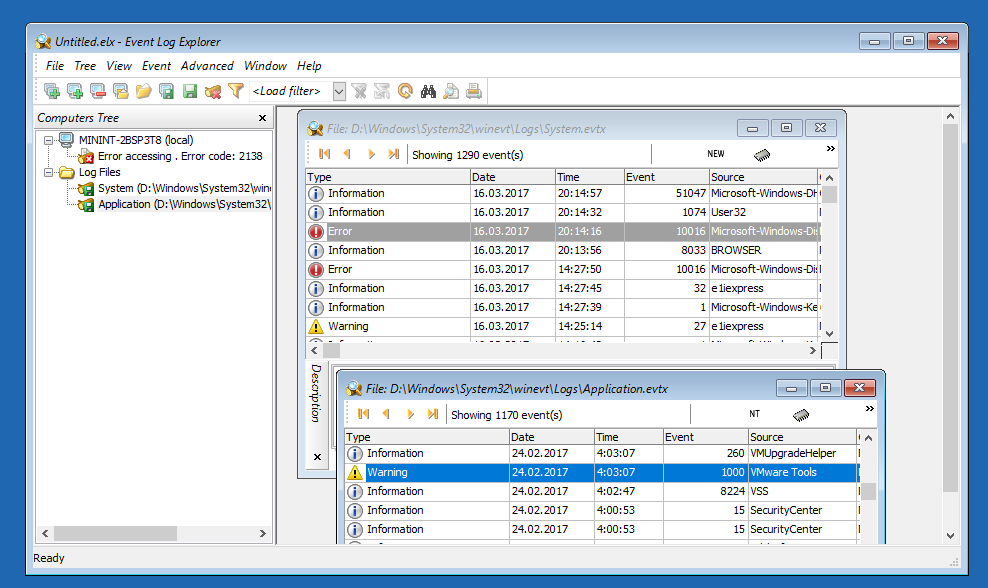
Now when a user prints a document, several events will be logged into PrintService/Operatinal event log.
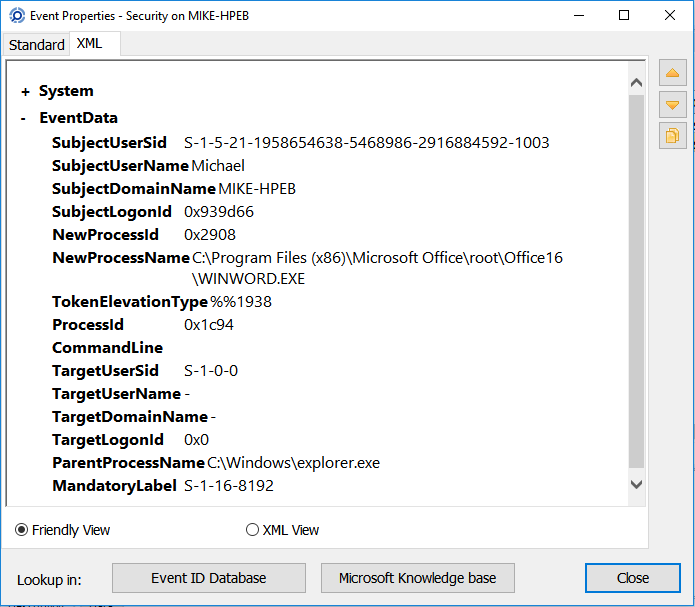
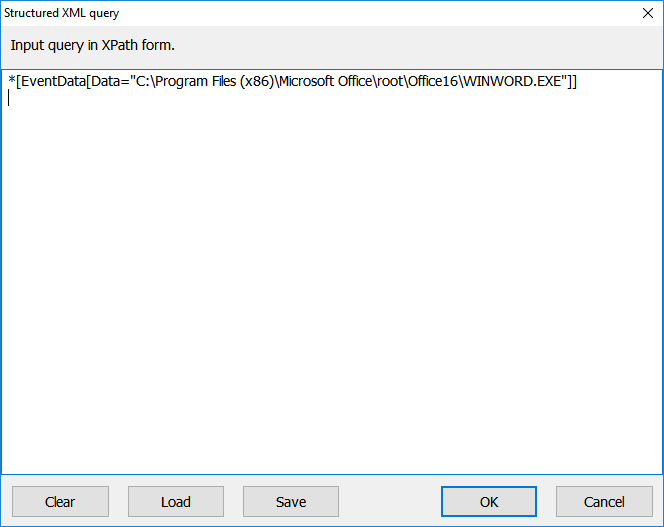
The most interesting event for printer usage tracking is event 307 (document was printed). If you open event details of this event and switch to XML representation, you will get detailed information about printing.
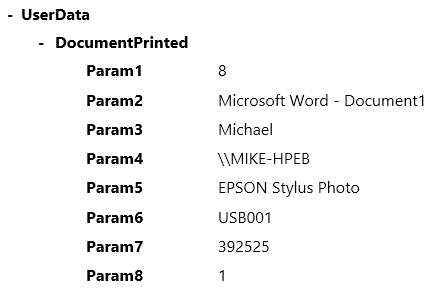
Param1 is a print job identifier and can be used to link with other events in this log.
Param2 is a document name (if you didn’t enable “Allow job name in event logs” policy, the document name will be “Print Document”.
Param3 and Param4 define document owner and computer from which the document was sent to print.
Param5 is a printer name.
Param6 is a name of the print server port.
Param7 is a document size in bytes sent to print server.
Param8 is a total number of pages printed by this print job.
So, let’s display some of these details in Event Log Explorer. I will add a printer user (a document owner), printer name, and number of pages as event list columns.
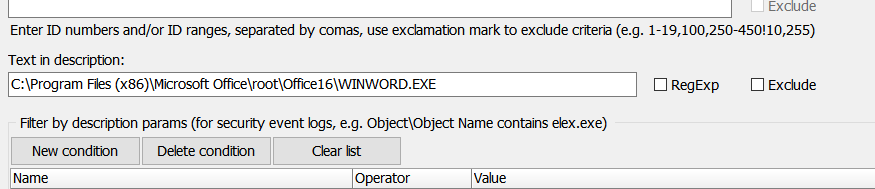
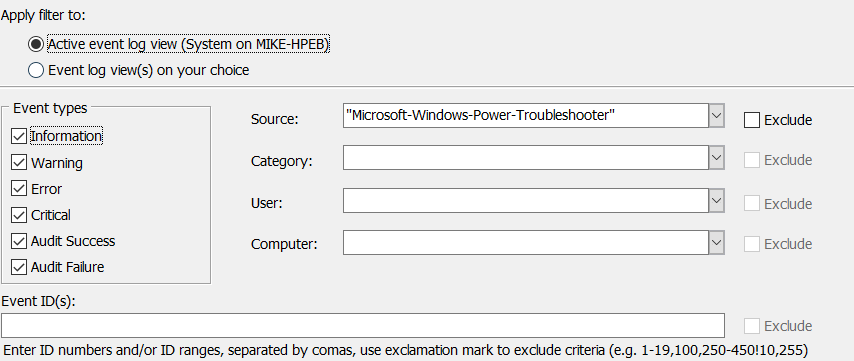
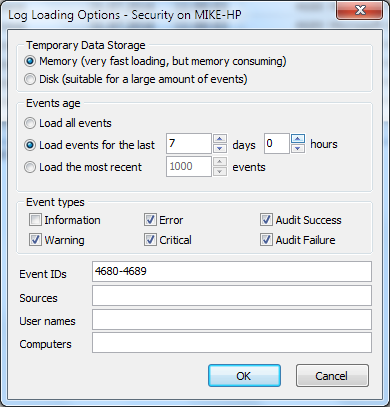
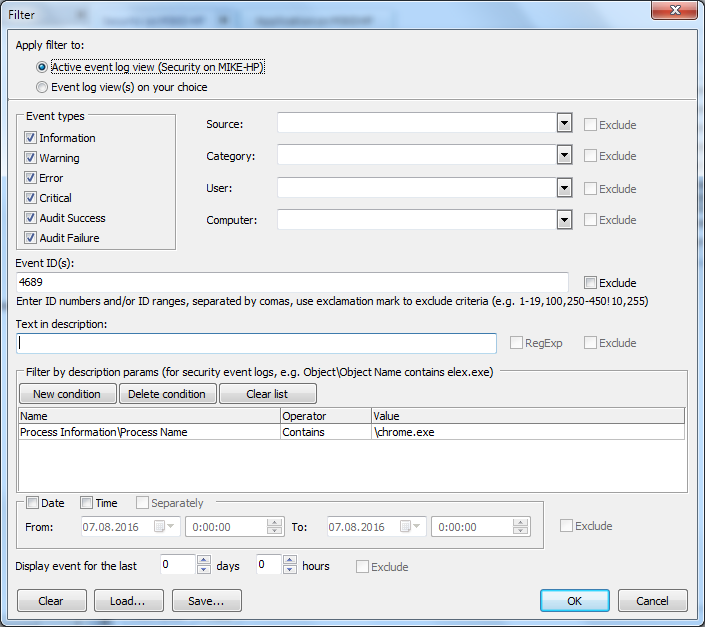
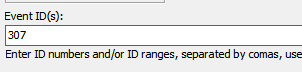
First, we need to filter unnecessary events out and display only events with event id = 307. Press Filter button and type 307 in Event ID(s) filed of the Filter window.
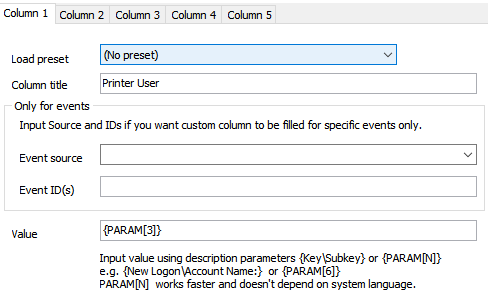
Now we should add custom columns. Select View->Custom columns from the main menu and add the first column (Printer user) as follows:
Column
title: Printer user
Value: {PARAM[3]}
Switch to Column 2 tab and add the second column:
Column
title: Printer
Value: {PARAM[5]}
Switch to Column 3 tab and add the second column:
Column
title: Pages
Value: {PARAM[8]}
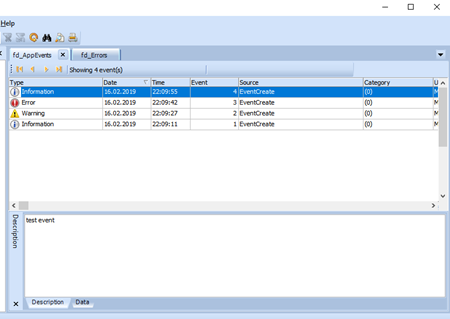
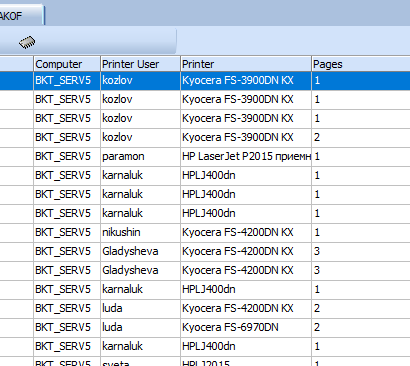
Press OK to finish and you will see 3 columns in the event list with your data.
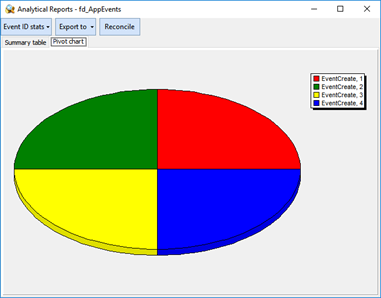
Now you can run Analytical Report and select Custom Column1 stats. This will summarize user print sessions and let you detect users who print a lot. However, this summary doesn’t take into account the number of pages, so I recommend using Excel for more accurate assessment.
To export to Excel, select File -> Export Log from the main menu. Select Excel 2007 document as a target format, make sure that All events is selected as export scope and tick fields Printer User, Printer and Pages. You can untick other fields.
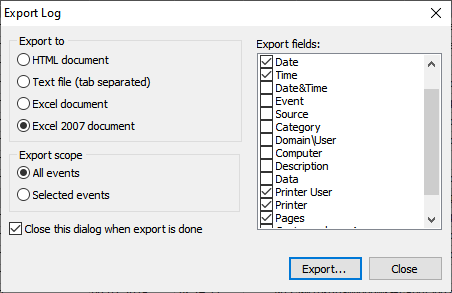
Press Export button and save your data in XLSX document.
That’s it. Now you can open your XLSX file in Excel and build summary reports from it.
P.S. Some companies may still use old Windows 2003 server to run their print servers. And Event Log Explorer will help in this case too. Print events for Windows 2003 are recorded into System log. Event source is Print, event id = 10. To display Printer user, Printer and page count as custom columns use {PARAM[4]} {PARAM[5]} and {PARAM[8]} respectively.
Download Event Log Explorer and start exploring your events right now!