When performing forensic analysis or system audit activities, you may want to track what programs ran on the investigated computers. Windows security auditing lets you enable process tracking and monitor process creation and process termination. To enable process auditing you should use Group Policy Editor (gpedit.msc) or Local Security Policy (secpol.msc). You should configure Security Settings -> Audit Policy -> Audit Process Tracking or use Advanced Audit Policy Configuration -> System Audit Policy -> Detailed Tracking. After enabling process auditing, Windows will register the following events in Security log:
4688 – A new process has been created.
4689 – A process has exited.
Let’s check what events generated when we run an application. I will run Event Log Explorer (elex.exe) for test. Running this application generates a number of events. First, as expected, event 4688 was registered in Security log:
A new process has been created.
Subject:
            Security ID:                  S-1-5-21-1388294503-2733603710-2753204785-1000
            Account Name:                 Michael
            Account Domain:               MIKE-HP
            Logon ID:                     000332DD

Process Information:
            New Process ID:               0000254C
            New Process Name:             C:\Program Files (x86)\Event Log Explorer\elex.exe
            Token Elevation Type:         TokenElevationTypeLimited (3)
            Creator Process ID:           00001010
            Process Command Line:

Token Elevation Type indicates the type of token that was assigned to the new process in accordance with User Account Control policy.

Type 1 is a full token with no privileges removed or groups disabled.  A full token is only used if User Account Control is disabled or if the user is the built-in Administrator account or a service account.

Type 2 is an elevated token with no privileges removed or groups disabled.  An elevated token is used when User Account Control is enabled and the user chooses to start the program using Run as administrator.  An elevated token is also used when an application is configured to always require administrative privilege or to always require maximum privilege, and the user is a member of the Administrators group.

Type 3 is a limited token with administrative privileges removed and administrative groups disabled.  The limited token is used when User Account Control is enabled, the application does not require administrative privilege, and the user does not choose to start the program using Run as administrator.
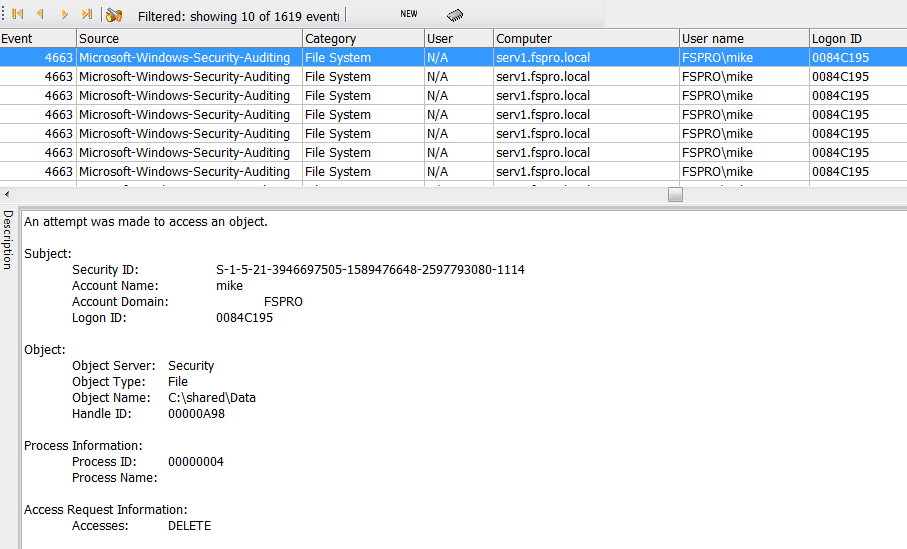
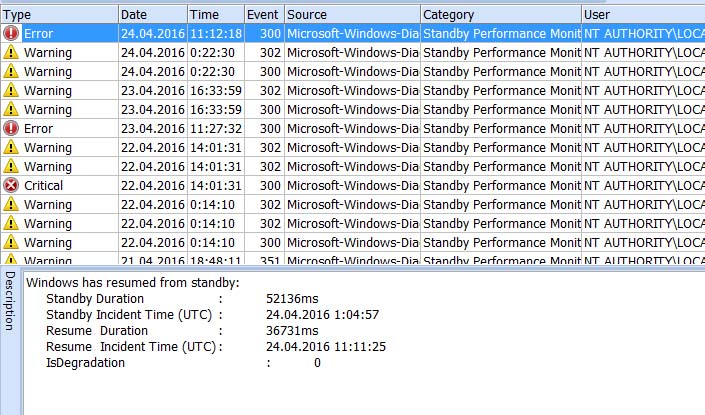
However, the next event (event id 4689) shows that this process has exit immediately:
A process has exited.

Subject:
            Security ID:              S-1-5-21-1388294503-2733603710-2753204785-1000
            Account Name:             Michael
            Account Domain:           MIKE-HP
            Logon ID:                 000332DD

Process Information:
            Process ID:               0000254C
            Process Name:             C:\Program Files (x86)\Event Log Explorer\elex.exe
            Exit Status:              C000042C
Let’s explore fields in the event descriptions. Subject group is quite clear. Just pay attention to Logon ID – using this ID you can link these events with event 4624 (account logon, New Logon\Logon ID). Process Information group is more interesting for process tracking.
New Process ID (Process ID for 4689 event) defines the ID of Windows process (created or terminated). Note that it is in hexadecimal format, so you need to match with process IDs in Task Manager or other programs, you need to convert it into decimal value.
New Process Name (Process Name) the full path to the executable.
Token Elevation Type defines how the process runs under UAC (User Account Control). Token Elevation Types are described in the event description. “1” means that UAC is disabled (set to Never Notify) or your run the program from Administrator account or a service account (e.g. when system services start, they will register 4688 event with elevation type = 1). “2” means that the user ran the process elevated. This happens when the program manifests itself to run elevated or the user explicitly ran the program using Run as Administrator option. “3” means that the process has been ran without elevation.
Creator Process ID defines a process ID of the process that started this new process. Note that it is in hexadecimal format as well as New Process ID.
Process Command Line defines a command line used to start the process. It includes the full path to the executable along with command line parameters. By default, Process Command Line is empty (because it may contains sensitive data like passwords). To enable command line logging you should enable policy “Include command line in process creation events”. This policy is available at Administrative Templates -> System -> Audit Process Creation.
Exist status (in event 4689) – the process exit code. Zero value commonly means that the process has exited normally.
In my example we can see that elex.exe has been terminated immediately after start with exit code C000042C. This code indicates that the process required elevation. Why this happens. The program (elex.exe) is designed to run elevated. When I started it by clicking on its icon, Windows tried to run it first and only then detected the program requires elevation. That’s why it terminated current instance.
What’s next? The next event is 4688 and Windows starts consent.exe process. This program displays Window UAC dialog and prompts the user for permissions to run our program elevated. Then (if the user accepts elevation) Windows starts dllhost.exe process (event 4688) to provide running COM+ components, terminates consent.exe (event 4689) and at last starts elex.exe (event 4688 with Token Elevation Type = 2). This means that we can ignore processes that terminated immediately with exist status of C000042C and when tracking the processes, I would recommend to exclude the helper processes like consent.exe, dllhost.exe, conhost.exe, svchost.exe, taskhost.exe.
If I start the program using “Run as administrator” option, Windows will not register first run/exit events, but register all the rest events (consent, dllhost, and elevated elex.exe).
Let’s practice
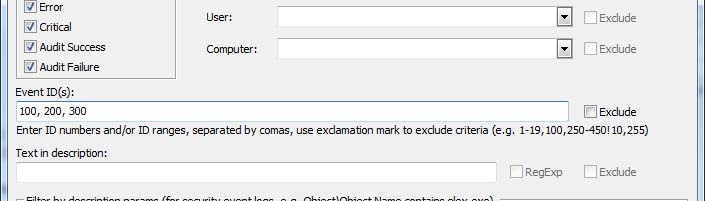
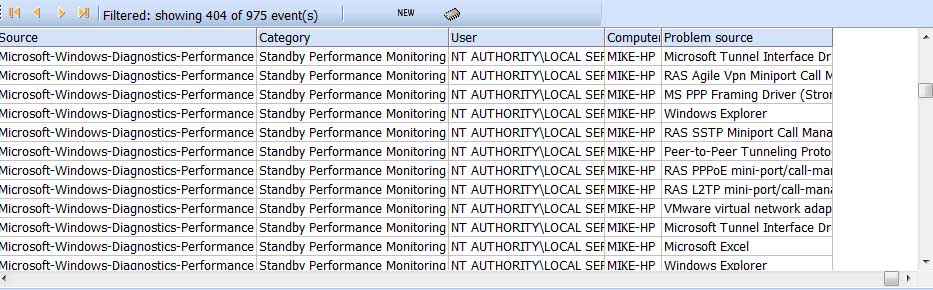
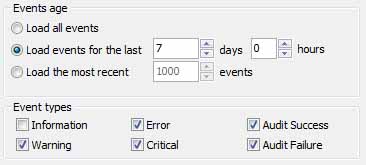
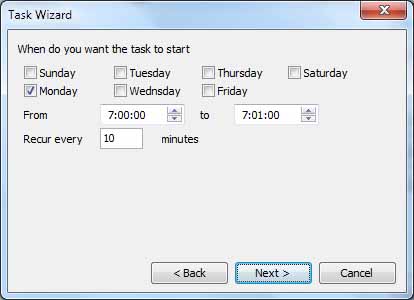
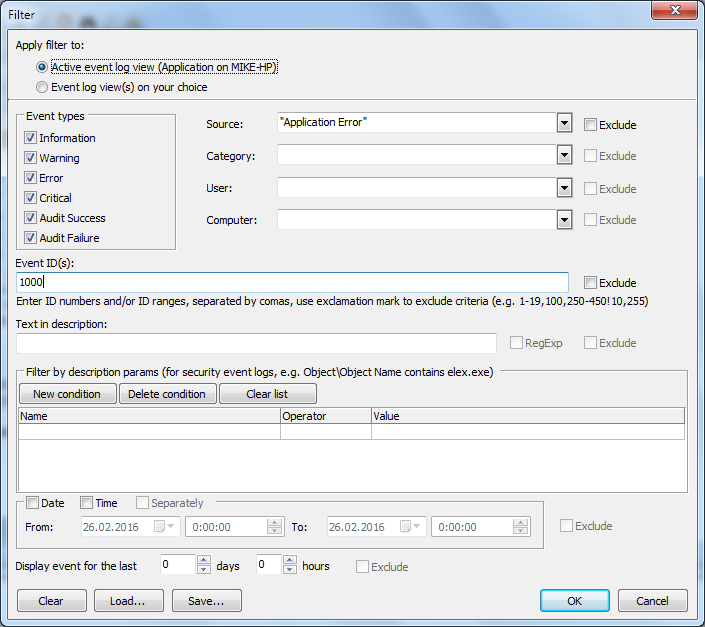
First we should filter Security log by event id = 4688, 4689. I will use Log Loading filter – but you can use general filter instead.
![]()
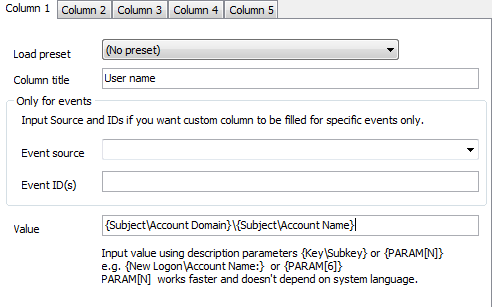
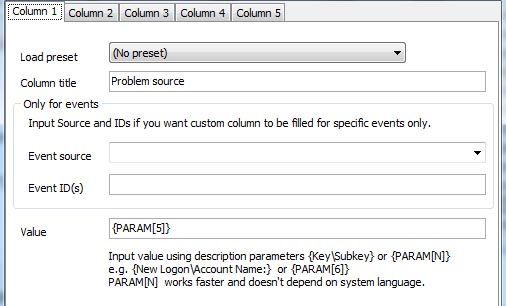
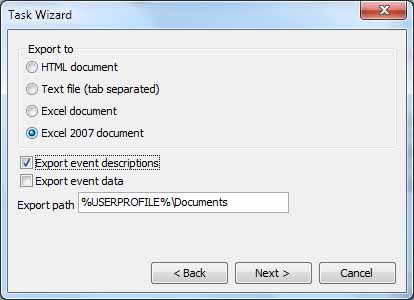
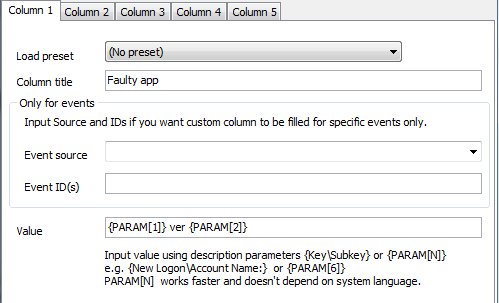
Now we can display process name (path to the executable) in the list as custom columns. I will add 2 custom columns – Process started and Process Terminated.
![]()
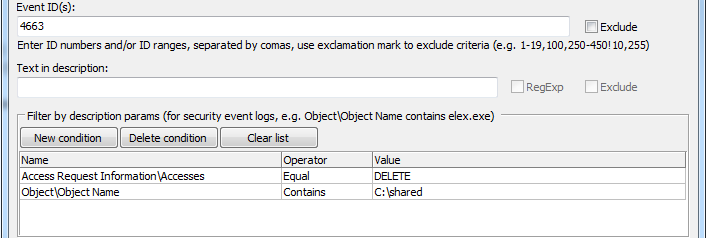
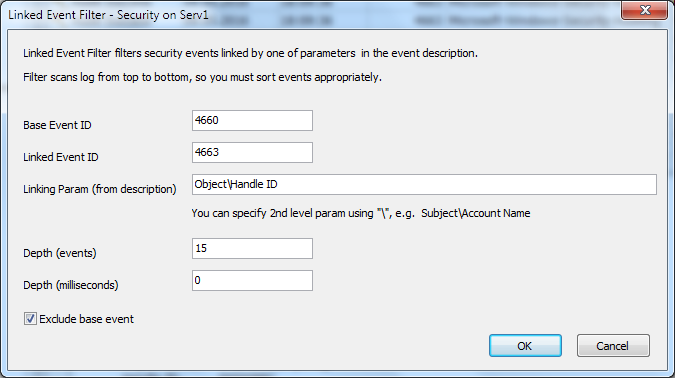
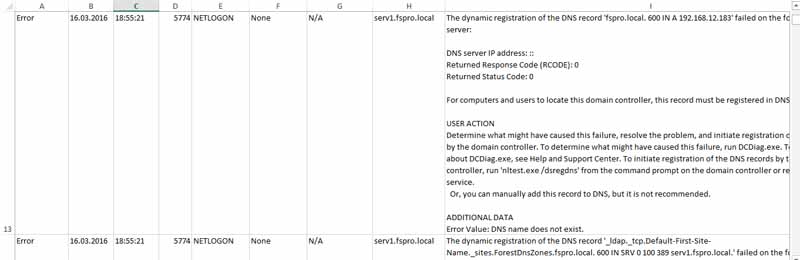
Let’s remove helper processes from the list. We can filter by description parameters:
 Process Information\Process Name  does not contain host.exe
 Process Information\New Process Name  does not contain host.exe
 Process Information\Process Name  does not contain consent.exe
 Process Information\New Process Name  does not contain consent.exe
![]()
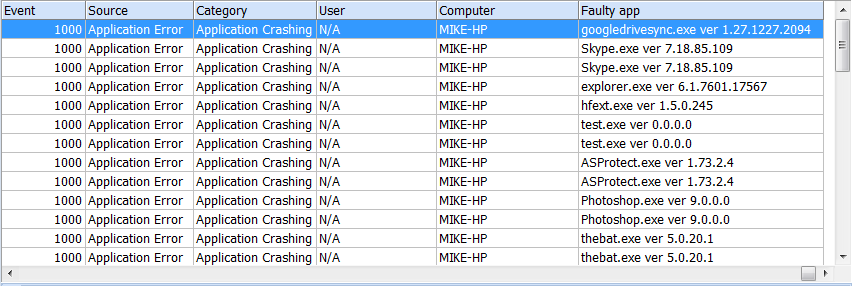
Now we can see the result:
![]()
Windows 10
Windows 10 (and forthcoming Windows 2016) comes with modified details of event 4688. The most significant addition is that the event description contains Creator Process Name field. It defines the name of the process that started this new process.