Recently we released a new edition of Event Log Explorer – Forensic Edition. Currently it has a beta version status – the final release will appear after we complete the documentation and add extra forensic features.
Here I will describe the difference between the standard and forensic editions.
The program keeps all features of the Standard Edition, and you commonly don’t need to use the Standard Edition if you have the Forensic one. Anyway, if you have a license key to Forensic Edition, you can use it with Standard Edition. However, if you have a license key to Standard Edition, it will work only with the current beta version of Forensic Edition but won’t work with the final release. You will be able to upgrade from Standard to Forensic by paying the price difference.
New program doesn’t require elevation when you run it. So, if you don’t have the admin rights, you can still run this program. The standard edition requires elevation to access the Security log and to manage event logs (e.g., clear them). Forensic users commonly work with log files, so it is not necessary to start it elevated. However, if you need to access the Security log, you may run it as Admin manually.
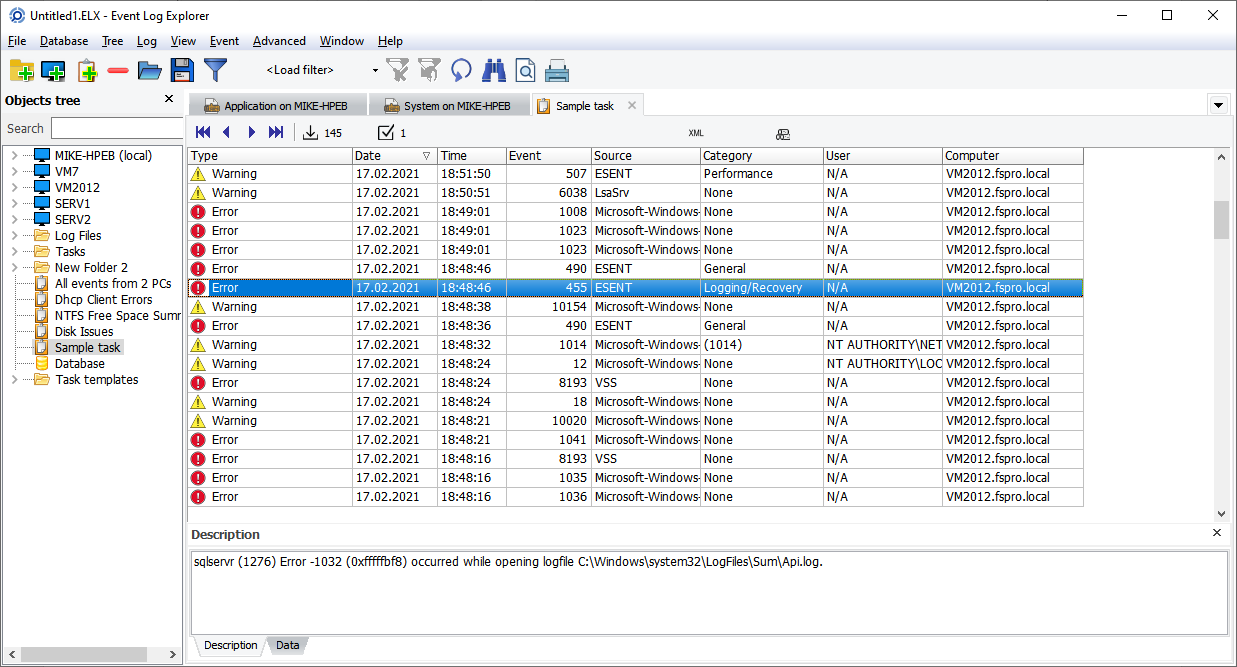
When you start the program, you can find the major difference between the editions in the user interface. There are two new menu items in the main menu: Forensics and Script.
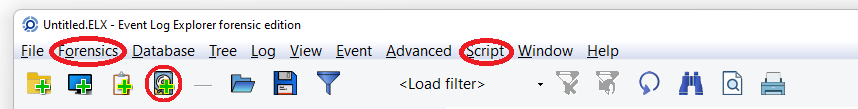
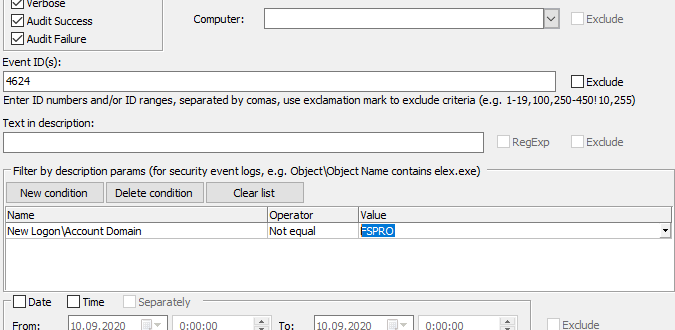
Script lets you create and run your own scripts (written in Pascal script) which helps you to automate some operations or create complex filters. We will add scripting to the Enterprise Edition of Event Log Explorer as well.
Forensics menu opens access to the forensic features of the program.
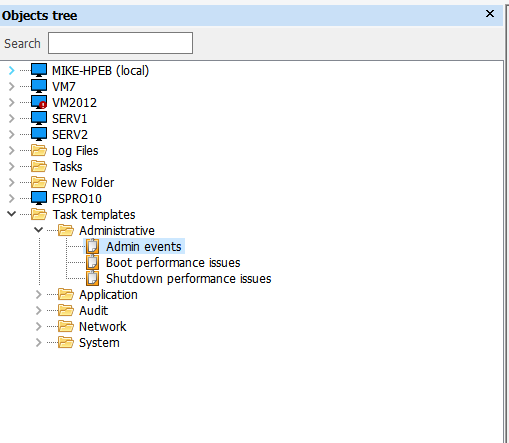
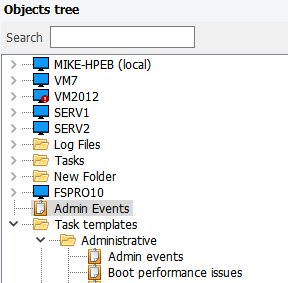
Add imaged computer lets you create a virtual computer in the Objects tree and access its log files as “live” logs.
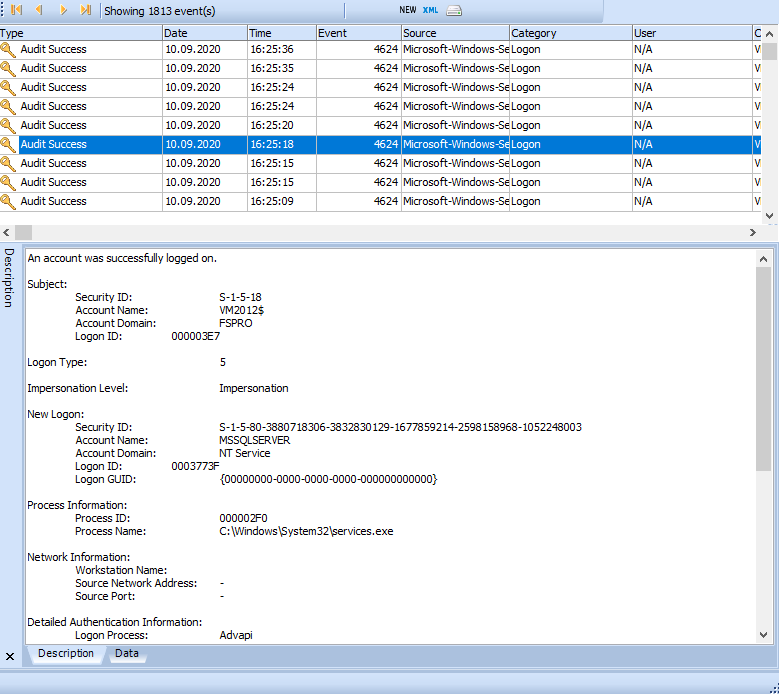
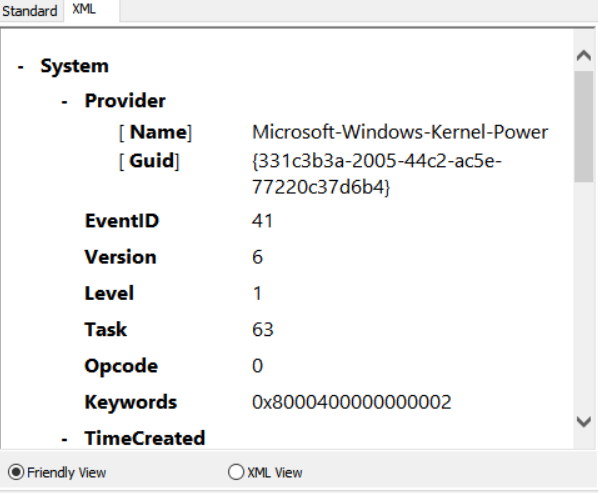
Forensic open file lets you open event log files using a “forensic” method. This includes opening files without Windows API and allows you to open damaged files.
Deep scan lets you scan an event log file, a disk image or even a whole disk for events. This lets you extract events from highly damaged log files or unmounted or damaged disk images.
Take and Load snapshot let you save your current event log view into a file for future analysis.
I will write several articles about each new forensic feature soon, but now you can download and try the new forensic edition yourself:
Download Event Log Explorer Forensic Edition right now to get access to new forensic features of the program.